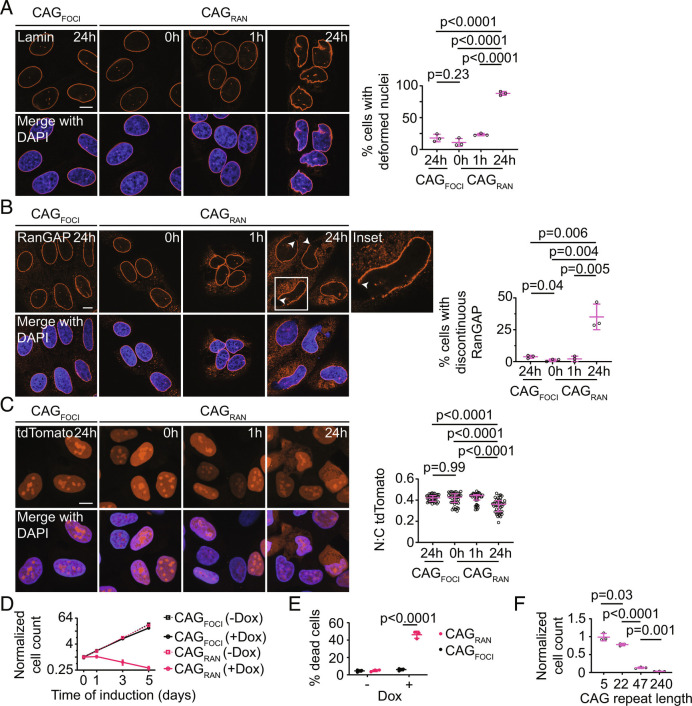
Fig. 4.
RNA–RAN protein aggregates disrupt nucleocytoplasmic transport and induce cell death. A and B, Representative immunofluorescence micrographs showing Lamin (A) or RanGAP1 (B) in cells expressing CAGRAN or CAGFOCI for the stated times (Left). Quantification of cells with deformed nuclei (A, Right) and discontinuous RanGAP1 staining (B, Right). Each data point represents an independent experiment (≥3 experiments) evaluating ≥40 cells. C, Representative micrographs of NLS-tdTomato-NES nuclear transport reporter in fixed cells expressing CAGRAN or CAGFOCI for the stated times (Left), and corresponding quantification of the nuclear to cytoplasmic tdTomato fluorescence (Right). Each data point represents a single cell and data are summarized as the median ± interquartile range, n ≥ 40 cells. Significance values were calculated by Mann–Whitney U tests. D, Quantification of cell populations expressing CAGRAN or CAGFOCI over 5 d, normalized to population size at day 0 (immediately prior to induction). Each data point is the mean of three biological replicates, and error bars denote SD. E, Quantification of cell death caused by expression of CAGRAN or CAGFOCI over 3 d, as measured by trypan blue staining. F, Quantification of cell populations expressing CAGRAN with varying number of CAG repeats 5 d post-induction. Cell counts are normalized to uninduced controls. Each data point in E and F represents a separate biological replicate, n ≥ 3. In A, B, E, and F, data are summarized as mean ± SD and significance values were calculated by Student’s t tests. Where indicated, cell nuclei are stained with DAPI. (Scale bars, 10 µm.)

