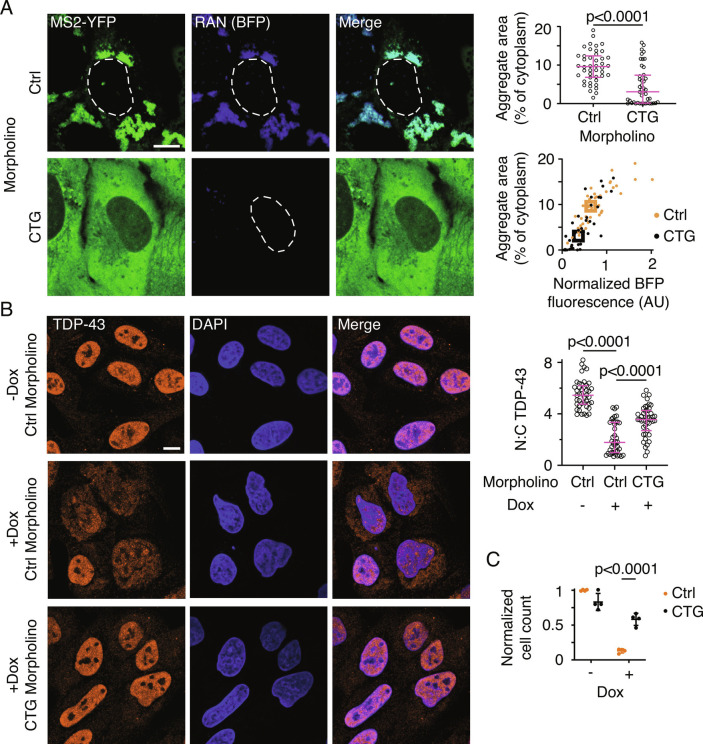
Fig. 5.
Inhibition of RAN translation prevents cell toxicity and nuclear transport defects. A, Representative micrographs of cells expressing CAGRANBFP for 24 h and treated with 50 µM of a control (Ctrl) or 8×CTG morpholino (CTG) for 48 h (Left). MS2–YFP images are independently scaled. Quantification of aggregate area (Right, Top) and in relation to BFP fluorescence (Right, Bottom). Data are representative of ≥3 independent experiments and ≥40 cells. B, Representative immunofluorescence micrographs showing TDP-43 localization in cells treated with indicated morpholinos for 48 h, with (+Dox) or without (−Dox) CAGRAN induction (Left), and corresponding quantification of the ratio of nuclear to cytoplasmic TDP-43 (Right). Cell nuclei are stained with DAPI. Data are representative of ≥40 cells. C, Quantification of cell survival 4 d post CAGRAN induction after treatment with the indicated morpholinos. Each data point represents a separate biological replicate, n = 4. Each data point in A and B represents a single cell; bar graph data are summarized as median ± interquartile range and boxes in the scatterplot in A represent the median values for each population. Significance values in A and B were calculated by Mann–Whitney U tests. Data in C are summarized as mean ± SD and the significance value was calculated by Student’s t test. (Scale bars, 10 µm.)

