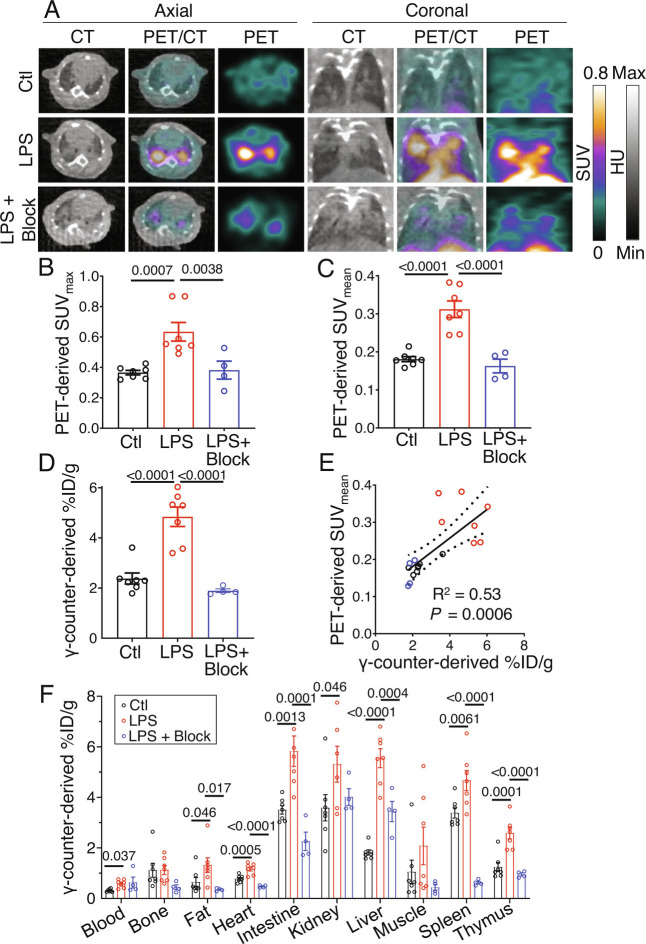
Fig. 2.
[64Cu]NODAGA-CG34 PET/CT in LPS-induced lung injury. (A) Representative axial (Left) or coronal (Right) CT, PET, and co-registered PET/CT images acquired ~90 min after intravenous tracer injection from a control mouse (Top row) vs. a mouse 2 d after intratracheal LPS administration (Middle row) demonstrate markedly increased lung uptake of [64Cu]NODAGA-CG34 mostly localized to regions of airspace opacities detected by CT. Co-injection of 100-fold molar excess of non-radiolabeled NODAGA-CG34 blocks the tracer uptake in inflamed lungs (Bottom row), confirming the specificity of tracer uptake. In vivo PET-derived quantification of tracer uptake demonstrates ~73% increase in lung SUVmax (B) and ~72% increase SUVmean (C) in LPS-injured mice compared to control mice (N = three males and four females per group), which is completely blocked by co-injection of excess non-labeled NODAGA-CG34 despite CT evidence of lung injury (N = two males and two females in the blocked group). (D) Quantification of tracer uptake by γ-counting confirms a similar pattern with 103% increased [64Cu]NODAGA-CG34 uptake in experimental lung injury, compared to control lungs, which is completely blocked by co-injection of unlabeled NODAGA-CG34. (E) In vivo PET-derived (SUVmean) and ex vivo γ-counting-derived (%ID/g) measurements of [64Cu]NODAGA-CG34 uptake correlate significantly (R2 = 0.53, P = 0.0006), confirming the accuracy of noninvasive quantification of tracer uptake in lungs. (F) Biodistribution of [64Cu]NODAGA-CG34, determined by ex vivo γ-counting (%ID/g) in select organs, demonstrated systemic inflammation upon LPS-induced lung injury as evidenced by multi-organ increases in [64Cu]NODAGA-CG34 uptake. SUVmax, SUVmean, and %ID/g data in panels B–E represent the average values of the left and right lungs for each mouse. PBS = phosphate-buffered saline; LPS = lipopolysaccharide. Data are expressed as the mean ± SEM. Linear regressions are shown along with 95% CIs. Statistical significance between groups was calculated using a one-sided ANOVA with a post hoc two-tailed Fisher’s exact test. Linear correlations were determined by calculating the Pearson correlation coefficient.

