Fig. 6.
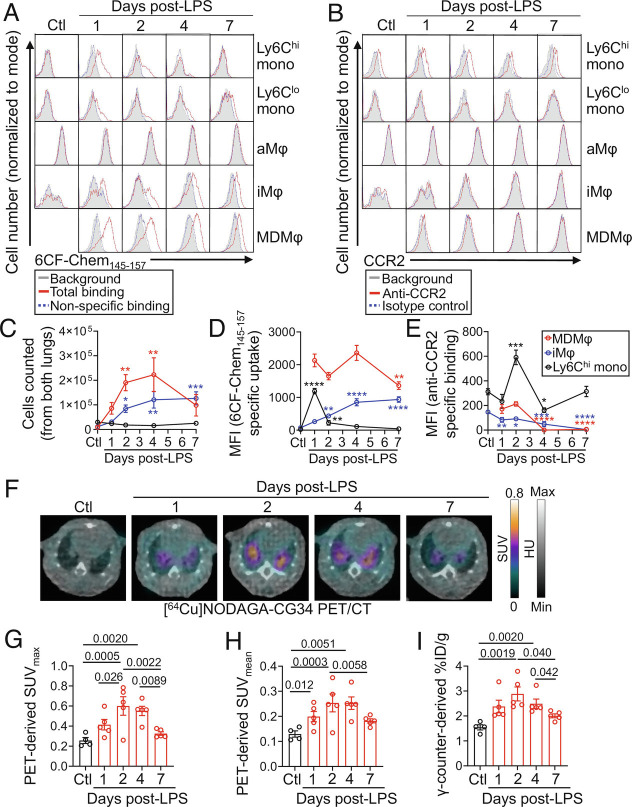
Kinetics of CMKLR1 and CCR2 expression by monocytes and macrophages during LPS-induced ALI and time course of [64Cu]NODAGA-CG34 PET/CT. (A and B) Representative histograms showing the specific uptake of a CMKLR1-targeted fluorescent ligand, 6CF-Chem145–157 (100 nm), or expression of CCR2 in lung monocytes and macrophages throughout the course of LPS-induced ALI (gray: background/autofluorescence; red: total-binding of 6CF-Chem145–157 in the absence of Chem145–157 or binding of a CCR2 antibody; blue: non-specific binding of 6CF-Chem145–157 in the presence of 10 µM Chem145–157 or binding of isotype control antibody). Data for monocyte-derived macrophages are omitted for the control group as the cell number was very low for accurate quantification. (C) The absolute number of Ly6Chi monocytes, interstitial macrophages, and monocyte-derived macrophages at different timepoints following LPS instillation. The number of monocyte-derived macrophages peaks on days 2 and 4, whereas the number of interstitial macrophages increases through day 7. By contrast, the number of Ly6Chi monocytes remains consistently low. (D and E) Specific 6CF-Chem145–157 uptake (total minus non-specific/blocked) or anti-CCR2 binding (anti-CCR2 minus isotype control) in Ly6Chi monocytes, interstitial macrophages, and monocyte-derived macrophages following LPS-induced lung injury. Monocyte-derived macrophages maintain high 6CF-Chem145–157 uptake throughout the course of ALI, whereas interstitial macrophages demonstrate increasing 6CF-Chem145–157 uptake through day 7. Ly6Chi monocytes show high 6CF-Chem145–157 uptake only on day 1. By contrast, CCR2 expression is primarily restricted to Ly6Chi monocytes in ALI with only a transient low-level CCR2 expression by monocyte-derived macrophages during days 1 and 2 after LPS administration. (F) Representative axial co-registered [64Cu]NODAGA-CG34 PET/CT images of mice at 1, 2, 4, and 7 d following LPS-treatment or non-treated controls. (G and H) In vivo PET-derived quantification of [64Cu]NODAGA-CG34 uptake demonstrates lung SUVmax and SUVmean peaking around 2 to 4 d post-LPS followed by a decrease on day 7. (I) Quantification of lung radiotracer uptake by γ-counting confirms a similar pattern of tracer uptake to that obtained by in vivo PET. SUVmax and SUVmean, and %ID/g values represent the average values of the left and right lungs for each mouse. Ctl = untreated mice; LPS = lipopolysaccharide; mono = monocytes; aMφ = alveolar macrophages; iMφ = interstitial macrophages; MDMφ = monocyte-derived macrophages. N for panels A–E: three male and two female mice except for day 2 with N = two male and three female mice; N for panels F–I: three male and two female mice except for control group with N = two male and two female mice. Data are expressed as the mean ± SEM. For panels C–E, comparisons were made between the various treatment timepoints to the control group for Ly6Chi monocytes and interstitial macrophages or to the 1-d treatment group for monocyte-derived macrophages (as the control group is omitted). P-values: * < 0.05; ** < 0.01; *** < 0.001; **** < 0.0001. Statistical significance was calculated using a one-sided ANOVA with a post hoc two-tailed Fisher’s exact test.

