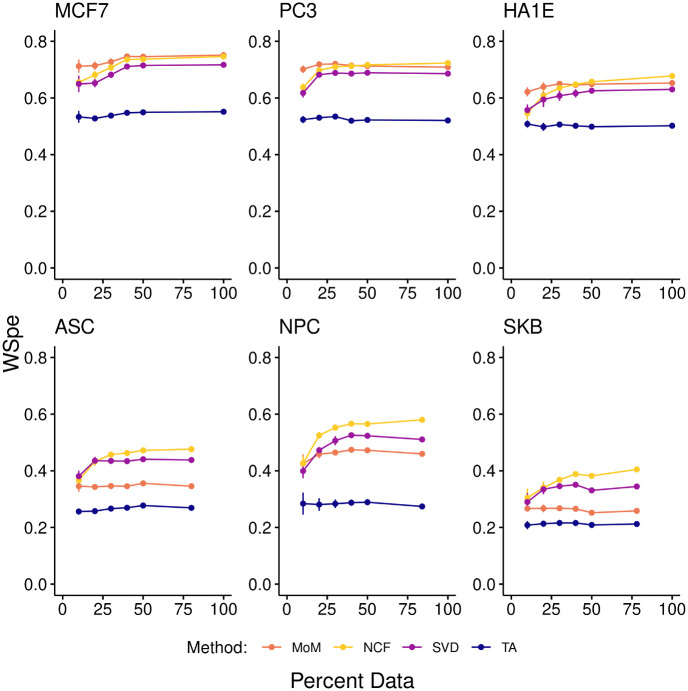
Fig 4. Downsampling.
Negative WSpe for the named cells across all genes and drugs (y-axis), as a function of the percentage of the 1330 compounds whose data was available for imputation. Maximum x-values on each plot reflect the actual amount of data for that cell; all other points reflect downsampling. Error bars show the variation across cross-validation runs; most are smaller than the data markers.

