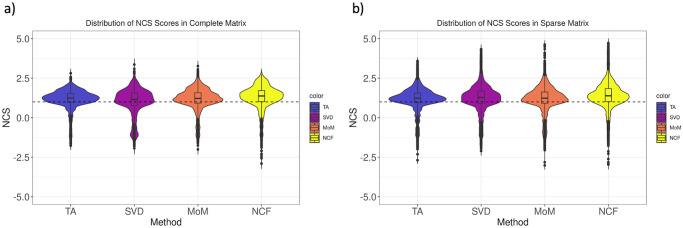
Fig 5. Distribution of connectivity scores for related drugs with imputed data.
a) Violin plot showing distribution of normalized connectivity scores of drugs from a given drug set imputed from the complete matrix. b) Violin plot showing distribution of normalized connectivity scores of drugs from a given drug set imputed from the sparse matrix. Dashed lines show an NCS of 1.0. Abbreviations: NCS: Normalized Connectivity Score for drug-set enrichment analysis as defined in section 2.5.1; TA: Tissue-Agnostic; NCF: Neighborhood Collaborative Filtering.

