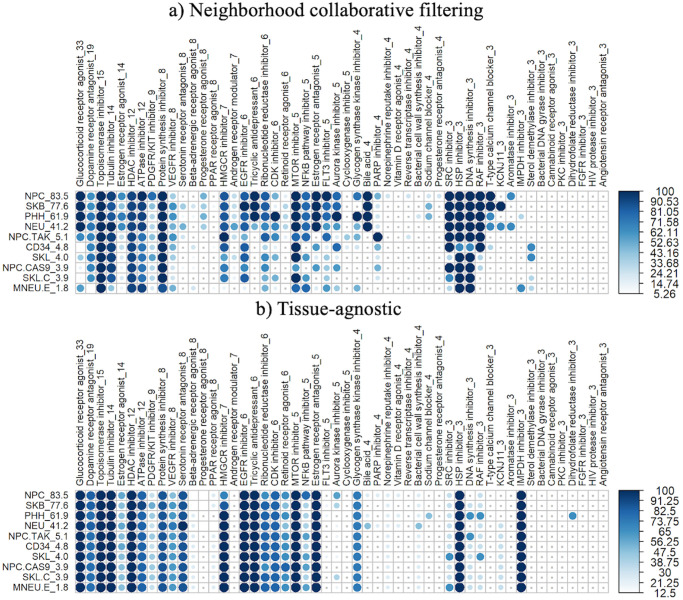
Fig 6. Recovery of imputed related drugs, by drug class and cell.
a) Percent of drugs correctly expressing strong connectivity to their drug class using the fully imputed sparse matrix by the neighborhood approach, for primary cells only. The number of drugs in each PCL set is included in the PCL name, and the percentage of drugs assayed in each cell type is included in the cell name. Darker and larger dots correspond to a the higher percentage of drugs with statistically significant NCS values (Section 2.5.1). Tiny grey dots represent PCL/cell combinations in which there were no statistically significant NCS values. Plots were generated using the corrplot package [26]. b) Percent of drugs correctly expressing strong connectivity to their drug class using the fully imputed sparse matrix by the tissue-agnostic approach, for primary cells.

