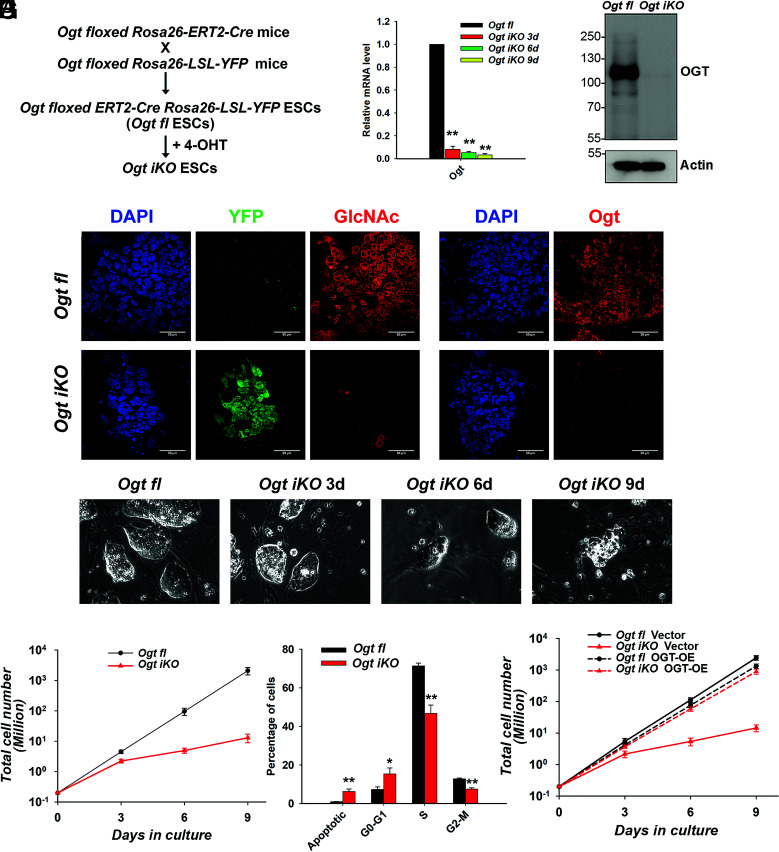
Fig. 1.
Generation of mESCs with inducible Ogt deletion. (A) Scheme used for the generation of inducible Ogt fl Cre–ERT2+/KI Rosa26-YFP+/KI (Ogt fl) mESC lines. (B) Quantitative real-time PCR (qRT-PCR) analysis of Ogt transcript levels in Ogt fl control and Ogt iKO mESCs 3, 6, and 9 d after 4-OHT treatment. The expression level of Ogt mRNA is shown relative to the level in control mESCs. Data are shown as mean ± SD (N = 3). (C) Western blot analysis of OGT protein level in Ogt fl mESCs treated with or without 4-OHT for 6 d. Actin was used as a loading control. (D) Immunohistochemistry of Ogt fl and Ogt iKO mESCs 6 d after 4-OHT treatment, using antibodies against O-GlcNAc and OGT. Nucleus staining: DAPI (blue). (Scale bar: 10 μm.) (E) Phase-contrast images of Ogt fl control and Ogt iKO mESCs 3, 6, and 9 d after 4-OHT treatment. (F) Cumulative growth curves of Ogt fl mESCs treated with or without 4-OHT at day 0 and counted at each passage (every 3 d) thereafter until day 9. Data are shown as mean ± SD (N = 3). Note the logarithmic scale on the Y-axis. (G) Percentage of Ogt fl and Ogt iKO mESCs 6 d after 4-OHT treatment in different phases of the cell cycle. Data are shown as mean ± SD (N = 3). (H) Cumulative growth curves of Ogt fl mESCs stably expressing empty vector or WT OGT and treated with or without 4-OHT. Data are shown as mean ± SD (N = 3). Note the logarithmic scale on the Y-axis.

