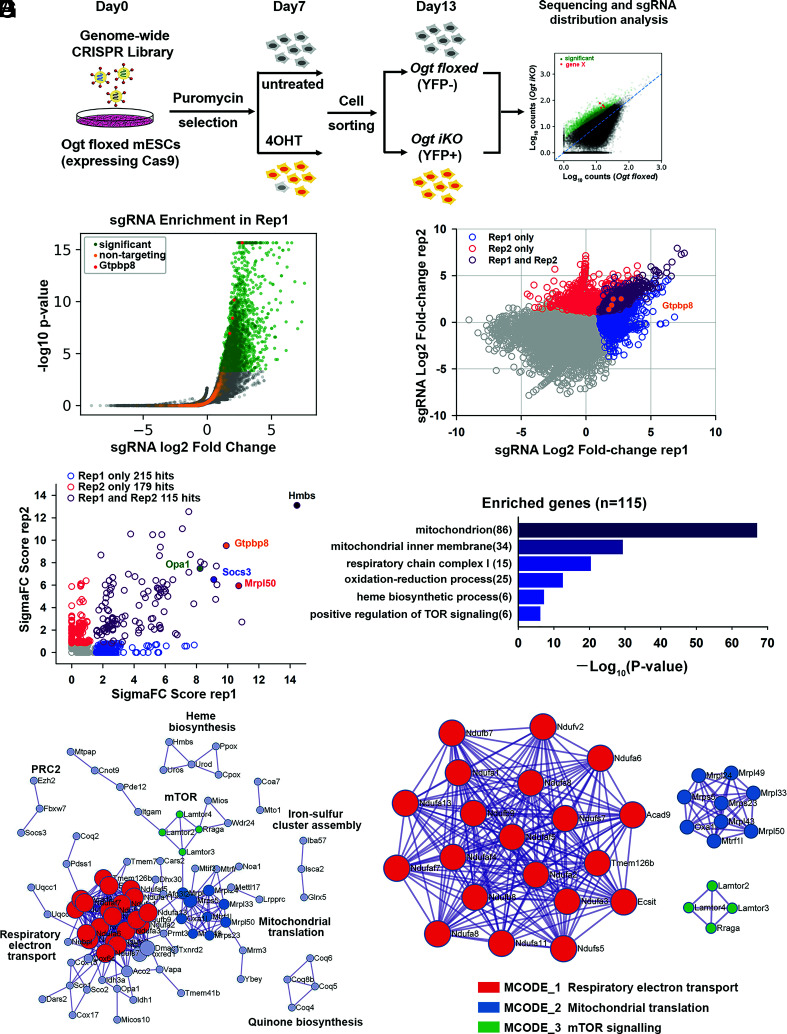
Fig. 2.
Genome-wide CRISPR–Cas9 screen to identify key regulators of cell survival in OGT-deficient mESCs. (A) Strategy for the genome-wide CRISPR–Cas9 viability screen to identify key regulators of cell growth in OGT-deficient mESCs. (B) Volcano plot of P-value versus fold enrichment for each sgRNA in Replicate 1. Significantly enriched sgRNAs are shown in green and nontargeting control sgRNAs in orange. All the four sgRNAs for Gtpbp8 were significantly enriched in the screen (red dots). (C) sgRNAs that were enriched in one or both biological replicates of the CRISPR–Cas9 viability screen. The four sgRNAs targeting Gtpbp8 are highlighted. The correlation between the fold changes in sgRNA abundance has a Pearson’s r of 0.438. (D) Rank of enriched hits by gene score, calculated based on the log fold changes of all sgRNAs targeting each gene and the number of sgRNAs targeting each gene that reached statistical significance. 115 enriched hits in both biological replicates are shown in purple. A few of the most highly scored hits (Hmbs,Gtpbp8, Opa1, Socs3, and Mrpl50) are labeled. (E) Gene ontology analysis of biological pathways of the 115 enriched hits. (F) Metascape visualization of the protein–protein interactome network of the 115 highly scored hits from the CRISPR screen. Each MCODE complex identified by Metascape was assigned a unique color. (G) Three MCODE complexes and their associated functional pathways identified by Metascape.

