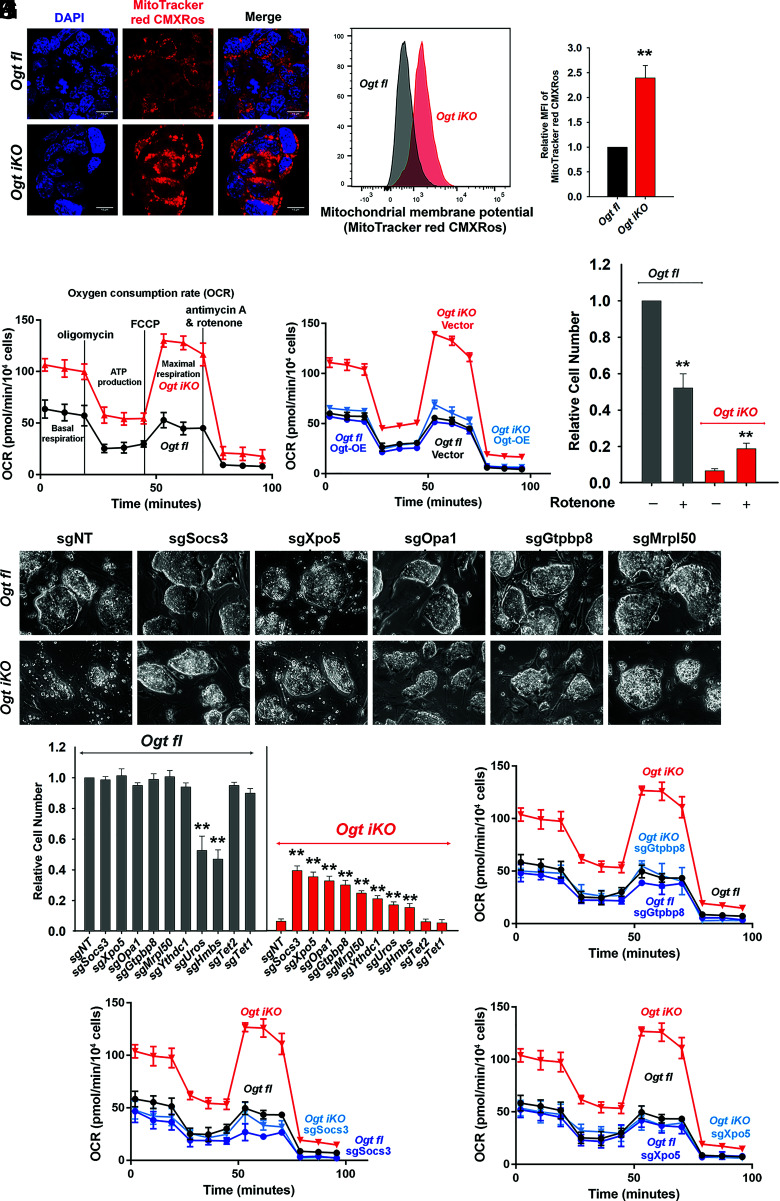
Fig. 3.
OGT deficiency results in mitochondrial dysfunction. (A) Fluorescence images of Ogt fl and Ogt iKO mESCs 6 d after 4-OHT treatment. Cells were stained with MitoTracker red CMXRos. Nucleus staining: DAPI (blue). (Scale bar: 10 μm.) (B) Representative histogram of MitoTracker red CMXRos fluorescence in Ogt fl and Ogt iKO mESCs 6 d after 4-OHT treatment. (C) Relative MFI (mean fluorescent intensity) of MitoTracker red CMXRos shown in Fig. 3B. (D) Analysis of OCR using Seahorse XFe24 in Ogt fl and Ogt iKO mESCs treated without or with 4-OHT, respectively, for 6 d. Data are shown as mean ± SD (N = 3). (E) Analysis of OCR using Seahorse XFe24 in Ogt fl mESCs stably expressing empty vector or WT OGT treated with or without 4-OHT for 6 d. Data are shown as mean ± SD (N = 3). (F) Relative cell numbers of Ogt fl and Ogt iKO mESCs treated without or with 4-OHT, respectively, and with or without the mitochondrial Complex I inhibitor rotenone (75 nM) for 8 d. Data are shown as mean ± SD (N = 3). (G) Phase-contrast images of Ogt fl and Ogt iKO mESCs expressing nontargeting sgRNA (sgNT) or sgRNAs targeting the indicated genes (Socs3, Xpo5, Opa1, Gtpbp8, and Mrpl50) and treated without or with 4-OHT, respectively, for 8 d. (H) Relative cell numbers of Ogt fl and Ogt iKO mESCs expressing nontargeting sgRNA (sgNT) or sgRNAs targeting the indicated genes (Socs3, Xpo5, Opa1, Gtpbp8, Mrpl50, Ythdc1, Uros, Hmbs, Tet2, or Tet1) and treated without or with 4-OHT, respectively, for 8 d. Data are shown as mean ± SD (N = 3). (I–K), Analysis of OCR using Seahorse XFe24 in Ogt fl and Ogt iKO mESCs expressing sgRNAs targeting Gtpbp8 (I), Socs3 (J), and Xpo5 (K) and treated without or with 4-OHT, respectively, for 6 d. Data are shown as mean ± SD (N = 3).

