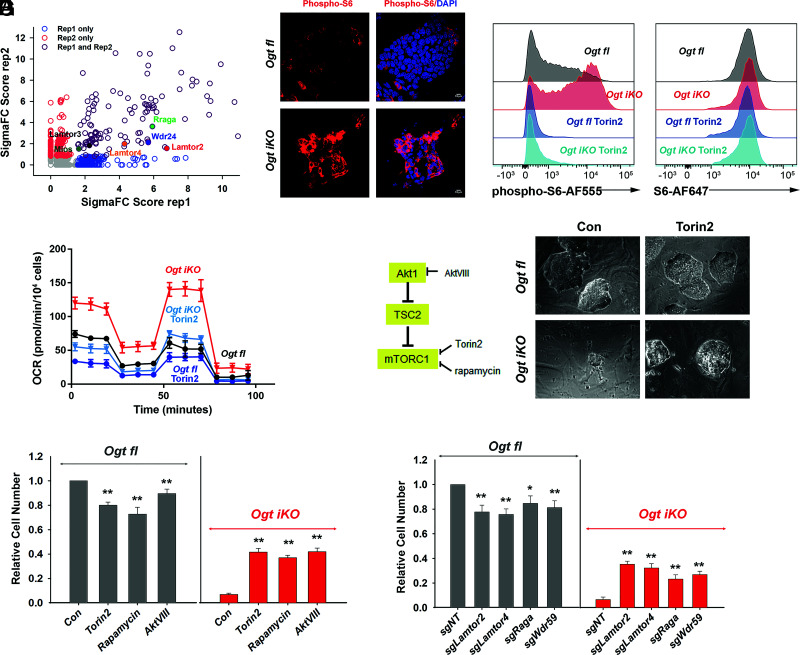
Fig. 4.
mTOR is hyperactivated in OGT-deficient mESCs. (A) Scatterplot of enriched genes by gene score. Genes related to positive regulation of mTOR signaling are highlighted. (B) Immunohistochemistry of Ogt fl and Ogt iKO mESCs treated without or with 4-OHT, respectively, for 6 d. Cells were stained with antibody against phospho-S6 ribosomal protein. Nucleus staining: DAPI (blue). Scale bar: 10 μm. (C) Flow cytometry analysis of phospho-S6 (Left) and total S6 (Right) ribosomal protein in Ogt fl and Ogt iKO mESCs treated without or with 4-OHT, respectively, for 6 d and then with or without 200 nM Torin2 for 2 h. Data are representative of three biological replicates. (D) Analysis of OCR using Seahorse XFe24 in Ogt fl and Ogt iKO mESCs treated without or with 4-OHT, respectively, and with or without Torin2 (25 nM) for 6 d. Data are shown as mean ± SD (N = 3). (E) Left, Simplified schematic diagram of mTOR pathway activation and the proteins targeted by the inhibitors Torin2 (25 nM), rapamycin (50 nM), and AktVIII (7.5 μM). Right, Phase-contrast images of Ogt fl and Ogt iKO mESCs treated with or without Torin2. (F) Relative cell numbers of Ogt fl and Ogt iKO mESCs treated without or with 4-OHT, respectively, and with or without Torin2 (25 nM), rapamycin (50 nM), and AktVIII (7.5 μM) for 8 d. Data are shown as mean ± SD (N = 3). (G) Relative cell numbers of Ogt fl and Ogt iKO mESCs expressing gRNAs against the indicated genes (Lamtor2, Lamtor4, Raga, and Wdr59) and treated without or with 4-OHT, respectively, for 8 d. Data are shown as mean ± SD (N = 3).

