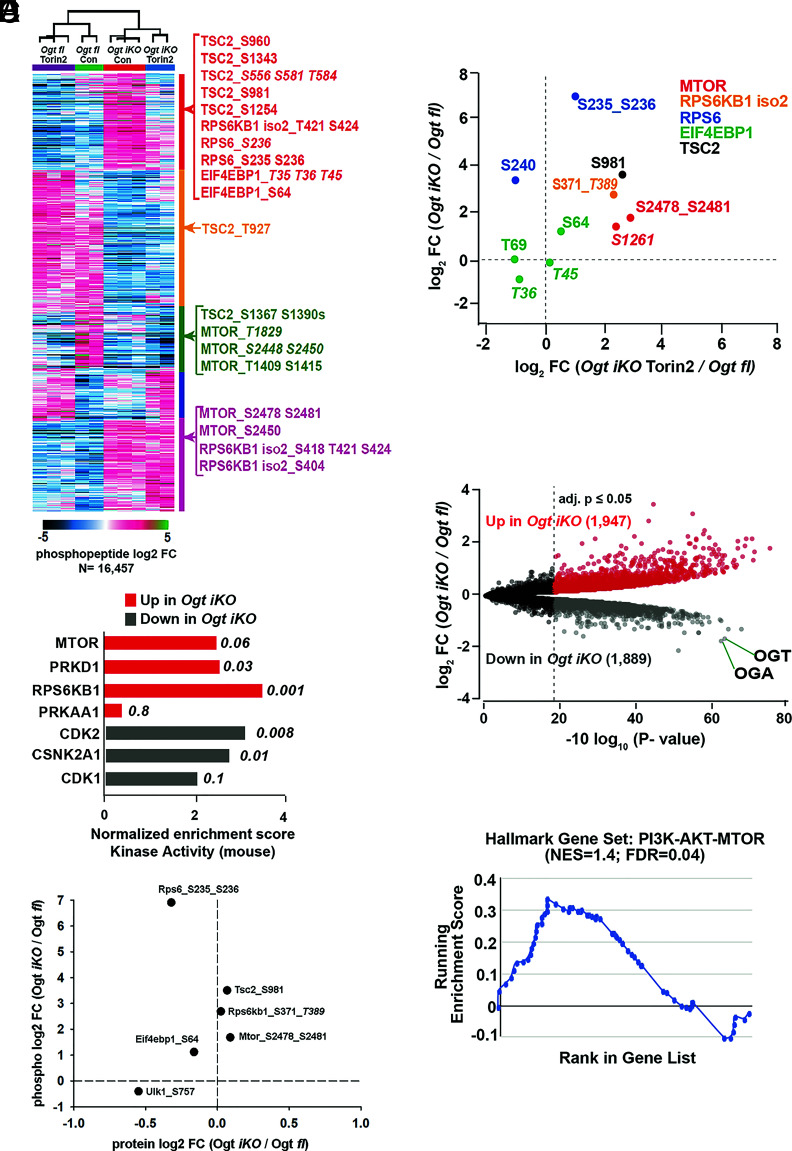
Fig. 5.
Extensive changes in global signaling and protein abundances in Ogt iKO mESCs. (A) K-means clustering analysis of all regulated (BH-corrected adjusted P-value ≥ 0.05) phosphopeptides as determined by a moderated F-test. Example phosphopeptides for canonical mTOR pathway components are highlighted. Italicized phosphosite numbers indicate phosphosite assignment ambiguity. (B) Normalized enrichment scores for kinase activity as determined by PTM-SEA of phospho-proteomics data performed in Ogt fl and Ogt iKO mESCs. Top three pathways in both directions, as well as their respective P-values, are shown. PRKAA1 (AMPKA1) is included as a comparison. Only mouse-derived PTM sets were used for the analysis. (C) Changes in phosphopeptide and protein levels of mTOR signaling components in Ogt fl and Ogt iKO mESCs as determined by quantitative proteomics. Italicized phosphosite numbers indicate phosphosite assignment ambiguity. (D) Changes in phosphorylation levels on mTOR signaling components upon Ogt deletion alone (y-axis) and Ogt deletion in the presence of Torin2 (x-axis). Both are relative to Ogt fl. Italicized phosphosite numbers indicate phosphosite assignment ambiguity. “Iso 2” refers to isoform 2 of RPS6KB1. (E) Volcano plot of differentially abundant proteins between Ogt-floxed and Ogt iKO mESCs. BH-corrected P-values of less than or equal to 0.05 are highlighted. (F) Leading edge analysis for proteome level-GSEA of proteins involved in the PI3K–AKT–MTOR pathway. Positive enrichment indicates up in Ogt iKO; negative, down in Ogt iKO. Normalized enrichment score and false discovery rate (FDR, q-value) are shown.

