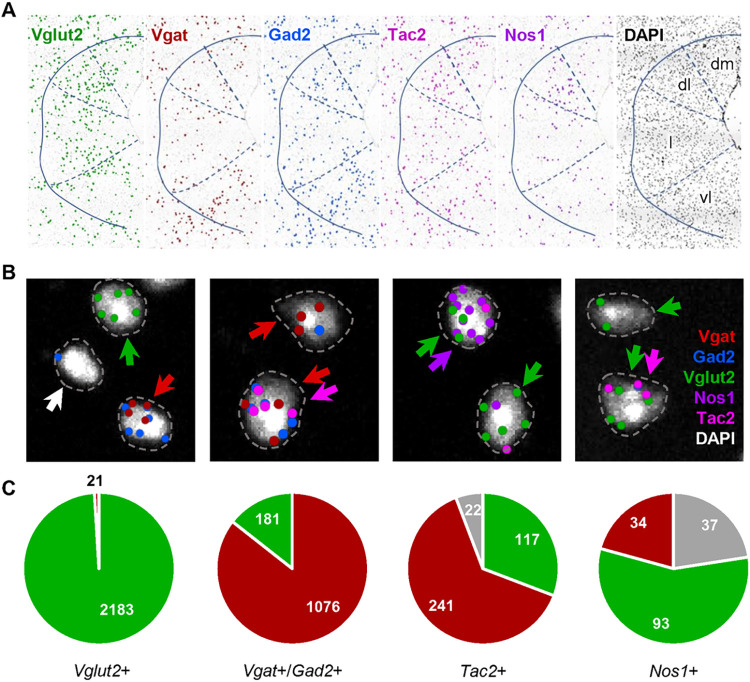
Fig 1. Colocalization of Nos1 and Tac2 with excitatory and inhibitory cells in PAG.
(A) Localization of Vglut2, Vgat, Gad2, Nos1, and Tac2 transcripts in PAG using multiplex in situ sequencing (ISS) showed regional patterns consistent with prior single gene in situ hybridization methods. DAPI signal was used to identify isolated cells and assign amplified ISS signals to putative single cells. The location of isolated cells that satisfied quality control criteria are represented by a single dot. (B) Representative images of cells classified as glutamatergic (red arrow), GABAergic (green arrow), Tac2+ (pink arrow), Nos1+ (purple arrow), or unclassified (white arrow). Genes were considered present if they showed at least two high quality (score > 2) spots (Vgat and Gad2 were considered equivalent) that fell within an expanded perimeter of DAPI signal (dotted line). (C) Distribution of co-expression of glutamatergic and GABAergic markers and their co-localization with Nos1 and Tac2 across three replicates in dPAG.

