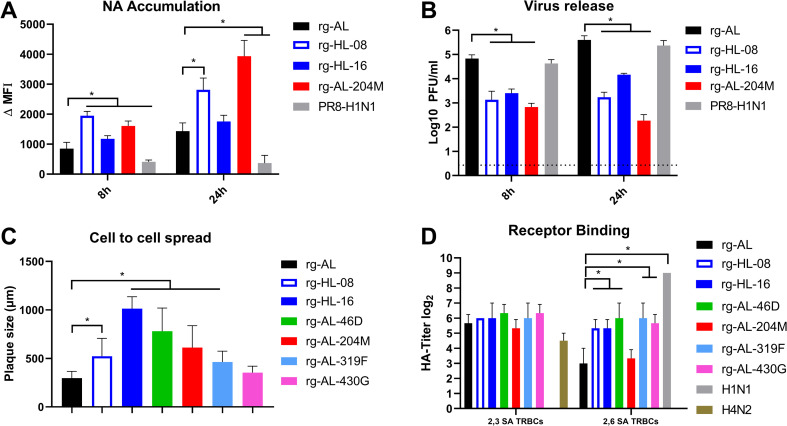
Fig 7. NA accumulation, virus release, cell-to-cell spread and affinity to modified turkey erythrocytes.
MDCK-II cells were infected with the indicated viruses with an MOI of 1 for 8 and 24 h and the accumulation of NA on the plasma membrane was measured by flow cytometry and polyclonal anti-N1 antibodies. The results are the mean and standard deviation of three independent replicates (A). Virus release into the supernatant was determined by plaque test. The results are the mean and standard deviation of three independent replicates (B). Cell-to-cell spread of indicated viruses was assessed by measuring the size of 100 plaques induced in MDCK-II at 72 hpi using NIS Nikon Software (C). Viruses were adjusted to 32 HA units using chicken erythrocytes. Shown is the HA titer of indicated viruses against resialiated turkey erythrocytes carrying avian 2,3- or human 2,6-sialic acid (SA). The HA test was conducted in three independent experiments (D). Asterisks indicate significant differences compared with rg-AL at p < 0.05.

