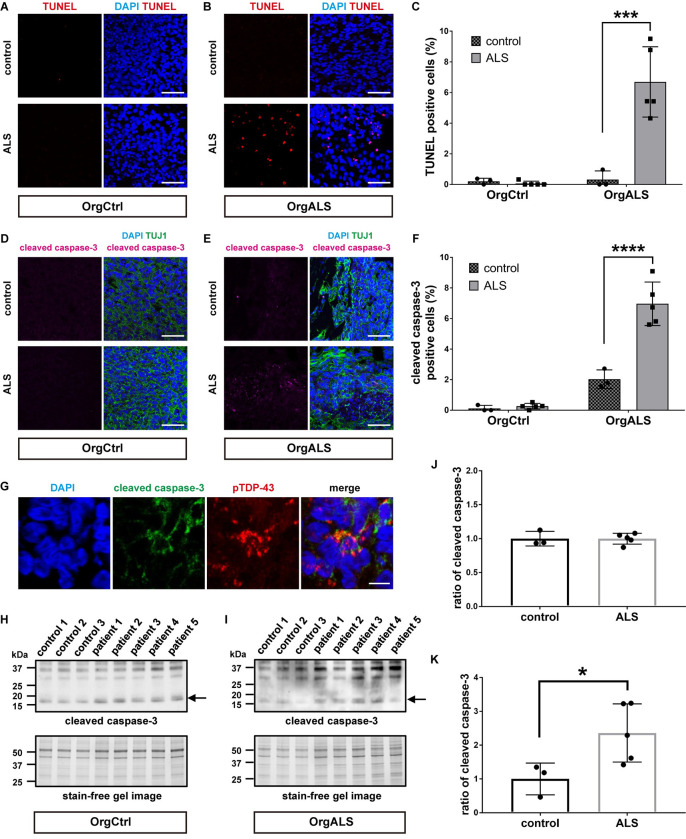
Fig 5. ALS patient-derived protein extracts cause cellular apoptosis in cerebral organoids.
(A and B) TUNEL stain images of OrgCtrl (A) or OrgALS cerebral organoids (B) at 8 weeks p.i. of protein extract from control (control 1) or ALS (patient 4). DAPI was used for counterstaining of nuclei. Scale bars = 50 μm. (C) Quantification analysis of TUNEL stain images of OrgCtrl and OrgALS cerebral organoids at 8 weeks p.i. of protein extract from individual controls (control 1–3) or ALS cases (patient 1–5) representatively shown in (A) and (B). Bar plots show mean ± SD with individual points representing a different protein extract. Percentages of TUNEL-positive cells were normalized to number of DAPI-positive cell nuclei. Differences were evaluated by two-way ANOVA with Tukey’s multiple comparisons test. ***p<0.005. (D and E) Immunofluorescence images of cleaved caspase-3 and TUJ1 staining OrgCtrl (D) or OrgALS cerebral organoids (E) at 8 weeks p.i. of protein extract from control (control 1) or ALS (patient 5). Scale bars = 50 μm. (F) Quantification analysis of cleaved caspase-3 staining immunofluorescence images of OrgCtrl and OrgALS cerebral organoids at 8 weeks p.i. of protein extract from individual controls (control 1–3) or ALS cases (patient 1–5) represented in (D) and (E). Bar plots show mean ± SD with individual points representing a different protein extract. Percentages of cleaved caspase-3-positive cells were normalized to number of DAPI-positive cell nuclei. Differences were evaluated by two-way ANOVA with Tukey’s multiple comparisons test. ****p<0.001. (G) Immunofluorescence images of cleaved caspase-3 and pTDP-43 (pS409/410) staining OrgALS cerebral organoids at 8 weeks p.i. of protein extract from ALS (patient 5). Scale bars = 10 μm. (H and I) Western blot analysis of cleaved caspase-3 expression in OrgCtrl (H) or OrgALS cerebral organoids (I) at 8 weeks p.i. of protein extracts from individual controls (control 1–3) or ALS (patient 1–5). A stain-free gel image was used for protein loading controls. Arrows indicate cleaved caspase-3 protein bands detected in approximately 17 kDa molecular weight. (J and K) Densitometric quantification of Western blot analysis in (J) and (K), respectively, using ImageJ software. Bar plots show mean ± SD with individual points representing a different protein extract. Each data point was obtained by normalization to bands in stain-free gel blot images. Differences were evaluated by unpaired t-test. *p<0.05.

