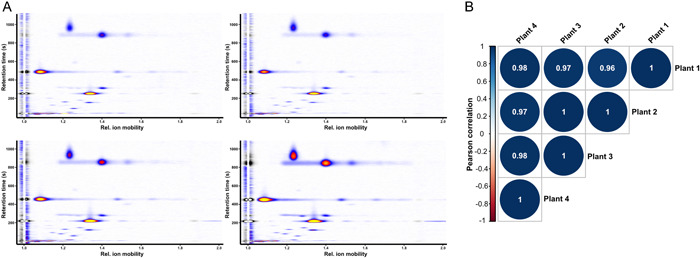
Figure 1.

Comparison of the intraspecific pVOC profiles of four individual plants from the species Narcissus fernandesii (section Jonquillae). (A) Heatmap visualization of the detected signals obtained from the GC–IMS measurements, showing the general agreement of emission patterns. The retention time (y‐axis) and relative ion mobility (x‐axis) provide information about the identity of a substance. The signal intensity is color coded, with blue for low intensity, red/orange for medium intensity, and yellow for high intensity. The signal intensity is a semi‐quantitative measure for the abundance of a substance. (B) Correlation matrix (Pearson correlation) of the four individual plants. The similarity between the pVOC profiles is indicated by 1 (dark blue) for a perfect correlation, 0 (white) for no correlation, and −1 (dark red) for a perfect anticorrelation (P = 0.01).
