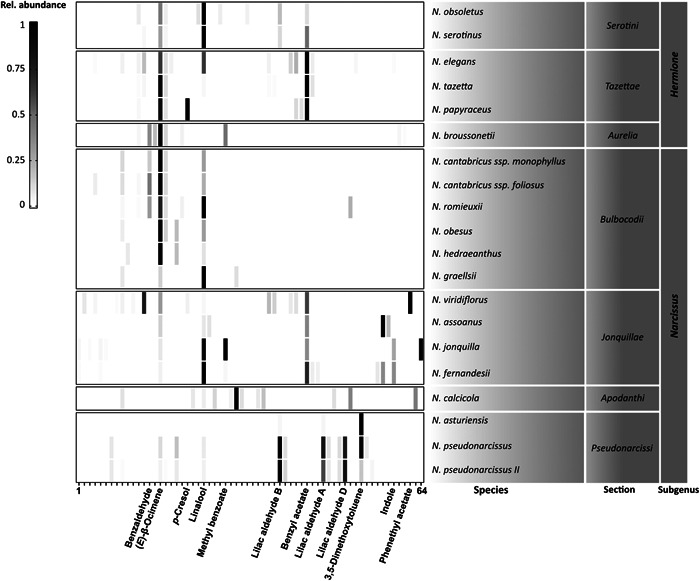
Figure 2.

Distribution and relative abundance of the 64 detected signals in the 20 studied taxa of Narcissus. The x‐axis represents the detected signals (ordered by increasing retention time). The main identified compounds are named. The color code represents the abundance of the compound relative to the strongest signal detected in that species, where 1 (black) represents the strongest signal in a species and 0 (white) indicates the absence of a certain signal. The species were grouped based on previous phylogenetic divisions (Fernandes, 1975).
