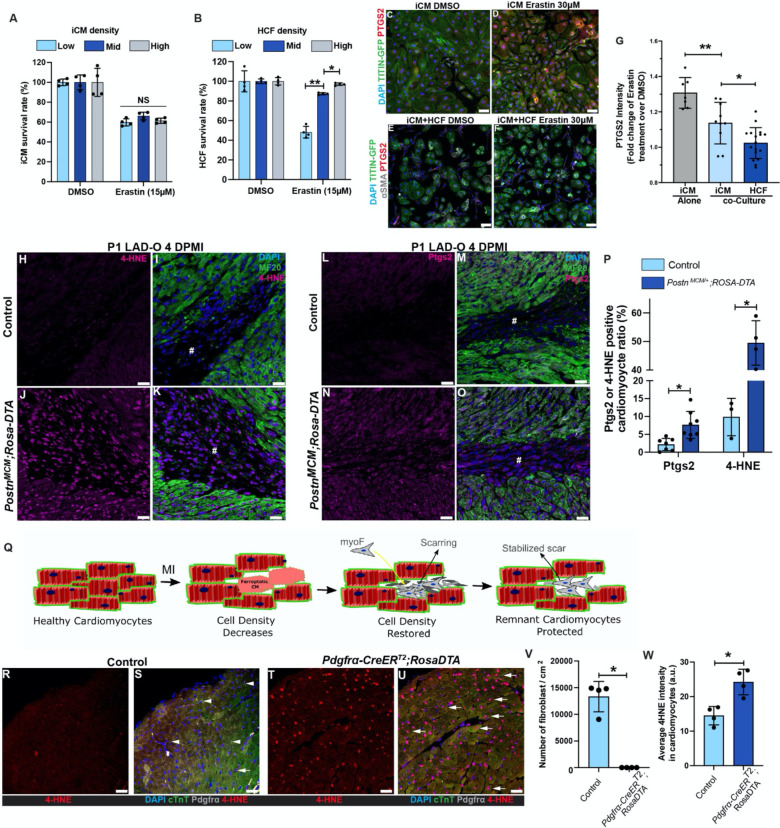
Figure 2. Cardiac fibroblasts protect cardiomyocytes from ferroptosis.
(A) Survival (negative for trypan blue) rates of iCMs cultured at low, mid or high density after erastin treatment (15 μM, 5 hours). (B) Survival rates of HCFs cultured at low, mid or high density after erastin treatment (15 μM, 5 hours). (C, D) PTGS2 (red) and DAPI (blue) were stained and imaged with endogenous TITIN-GFP (green) in iCM after erastin (30 μM) treatment. (E, F) PTGS2 (red), αSMA (grey) and DAPI (blue) were stained and imaged with endogenous TITIN-GFP (green) in co-cultured iCMs and HCFs after erastin (30 μM) treatment. (G) Fold change of PTGS2 fluorescent intensity in iCMs and HCFs. (H-O) Heart tissue of controls (PostnMCM/+, H, I, L, M) and PostnMCM/+;ROSA-DTA (J, K, N, O) mice were stained for 4-HNE (magenta, H-K) or Ptgs2 (magenta, L-O) at 4 DPMI after P1 LAD-O, tamoxifen was administrated daily at 1–3 DPMI. Green, MF20; blue, DAPI. #, infarct zone. (P) Ratio of cardiomyocytes positive for Ptgs2 or 4-HNE. (Q) Schematic of cardiac fibroblasts entering scar zone to increase cardiac cell density and rescue cardiomyocyte from ferroptosis. (R-U) Heart sections of 2-month-old control (ROSA-DTA, R, S) and Pdgfrα-CreERT2;ROSA-DTA (T, U) mice stained for 4-HNE (red), cTnT (green), Pdgfrα (grey) and DAPI (blue) after tamoxifen administration (see Figure S3). (V) Density of Pdgfrα-positive cells in control and mutant groups. (W) Average 4-HNE intensity in cardiomyocytes from both groups. #, infarct zone. Error bars indicate SD. *, p<0.05. **, p<0.01. NS, not significant. NS in A, no significance among three groups. Scale bar, 50 μm (C-F), 25 μm (H-O, R-U).
See also Figure S3.

