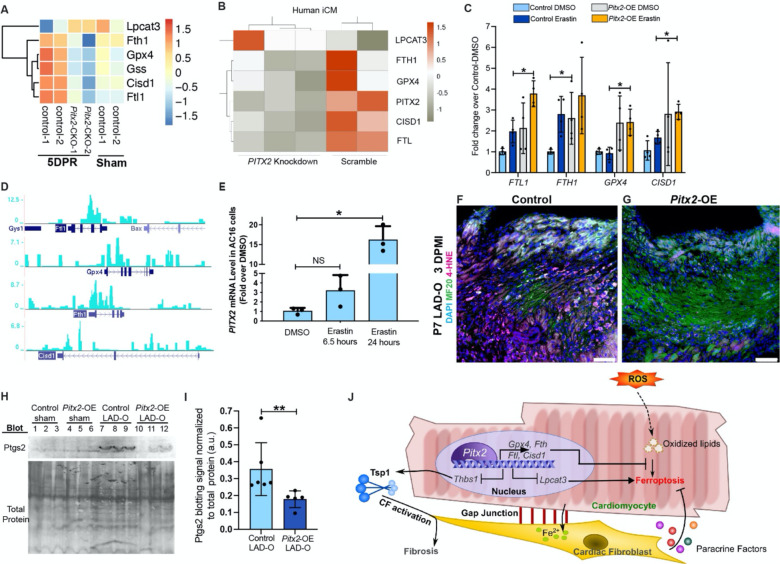
Figure 7. Pitx2 prevents ferroptosis in cardiomyocytes by regulating ferroptotic genes.
(A) Heatmap shows transcript level of ferroptotic genes in Pitx2-CKO (MCKcre;Pitx2f/f) ventricles and controls (Pitx2f/f) at 5 days after apex resection (DPR) or sham. (B) Heatmap shows transcript level of ferroptotic genes in human iCMs after siRNA knockdown of PITX2, with scramble controls. (C) qPCR of ferroptotic targets in iCMs after vehicle or erastin treatment, with PITX2-expressing or control lentivirus transduction. (D) ChIP-Seq showing Pitx2 binding region near ferroptotic gene loci in regenerating neonatal ventricles. (E) qPCR of PITX2 in AC16 cells treated with vehicle or erastin. (F, G) Heart tissue of control (F) and Pitx2-OE (G) were stained for 4HNE (magenta), MF20 (green) and DAPI (blue) at 3 days after P7 LAD-O. Tamoxifen was administrated daily from P6-8. (H, I) Western blot of Ptgs2 in control and Pitx2-OE left ventricles at 3 days after sham or LAD-O at P7. Ptgs2 band intensity quantified in I. (J) Working model of cardiomyocytes interacting with fibroblasts to regulate ferroptosis after MI. Error bars indicate SD. *, p<0.05; **, p<0.01. NS, not significant. Scale bar, 75 μm (F, G).

