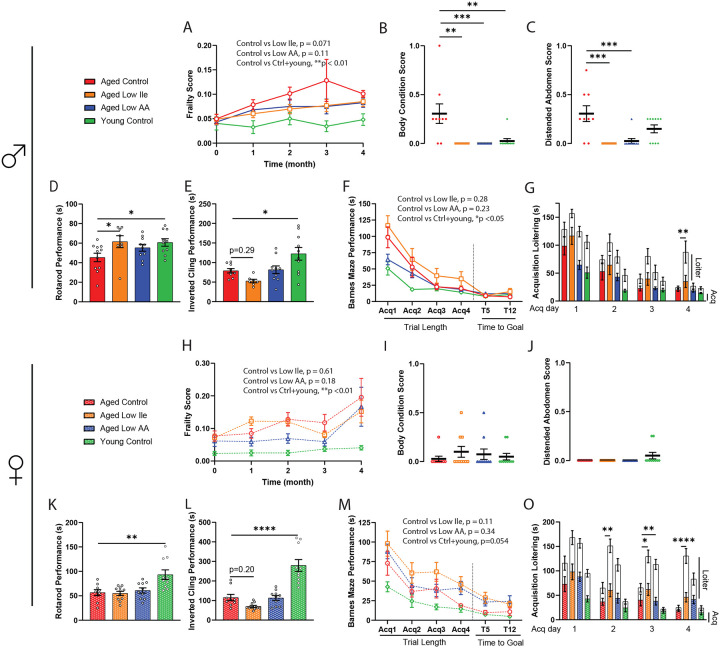
Figure 2. Late-life feeding of Low Ile and Low AA diets promote aspects of healthspan, particularly in male mice.
(A–C) Frailty score of male mice (A) was tracked throughout the experiment between 20 and 24 months of age (n=10–13/group, p-value represents the result of the indicated 2-way mixed-effects analysis). (B–C) Selected individual frailty categories, presented as the average of scores during the 3rd and 4th month of the experiment. (A-C) n=10–13/group at the beginning of the experiments, ANOVA followed by Dunnett’s test vs. Aged Control-fed mice. (D–E) Male rotarod (D) and inverted cling (E) performance were assessed between 22–23 months of age (n=8–11/group, ANOVA followed by Dunnett’s test vs. Aged Control-fed mice). (F–G) Male Barnes Maze Test performance at 24 months of age (F). n=7–10/ group, p-value represents the effect of diet in the indicated 2-way ANOVA, acquisition time only. (G) Barnes Maze Test acquisition trial duration with loitering (test on loitering time only, ANOVA followed by Dunnett’s test vs. Aged Control-fed mice). (H–J) Frailty score of female mice (H) was tracked throughout the experiment between 20 and 24 months of age (n=10–11/group, p-value represents the effect of diet in the indicated 2-way ANOVA). (I–J) Selected individual frailty categories, presented as the average of scores during the 3rd and 4th month of the experiment. (H–J) n=10–11/group at the beginning of the experiments, ANOVA followed by Dunnett’s test vs. Aged Control-fed mice. (K–L) Female rotarod (K) and inverted cling (L) performance were assessed between 22–23 months of age (n=8–11/group, ANOVA followed by Dunnett’s test vs. Aged Control-fed mice). (M–O) Female Barnes Maze Test performance at 24 months of age (M). n=8–10/ group, p-value represents the effect of diet in the indicated 2-way ANOVA, acquisition time only. (O) Barnes Maze Test acquisition trial duration with loitering (test on loitering time only, ANOVA followed by Dunnett’s test vs. Aged Control-fed mice). *p<0.05, **p<0.01, ***p<0.001, ****p<0.0001. Data presented as mean ± SEM.

