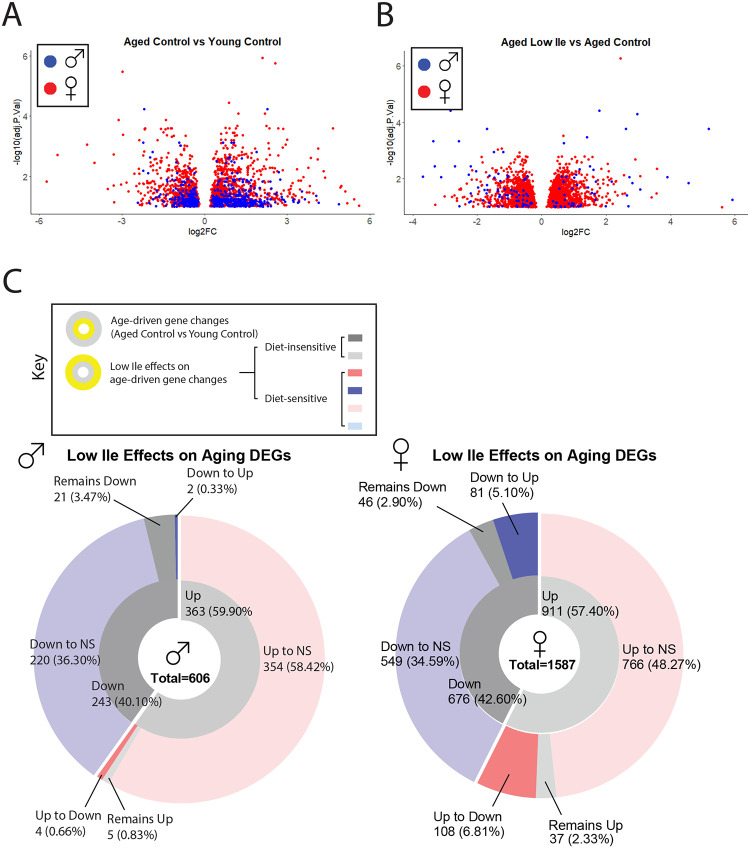
Figure 6. Late-life feeding of a Low Ile diet rejuvenates the liver transcriptome.
(A–B) Volcano plots of differentially expressed genes in the liver of male (blue) and female (red) mice with age (A) and diet (B). All DEGs are determined at α = 0.10. (C) A summary of the effect of Low Ile on the age-driven differentially expressed gene sets in males (left) and females (right). Inner ring represents the genes up or downregulated by aging, while the outer ring represents the effect of a Low Ile diet on the DEGs altered with aging. n=5–6/group.

