Figure 1.
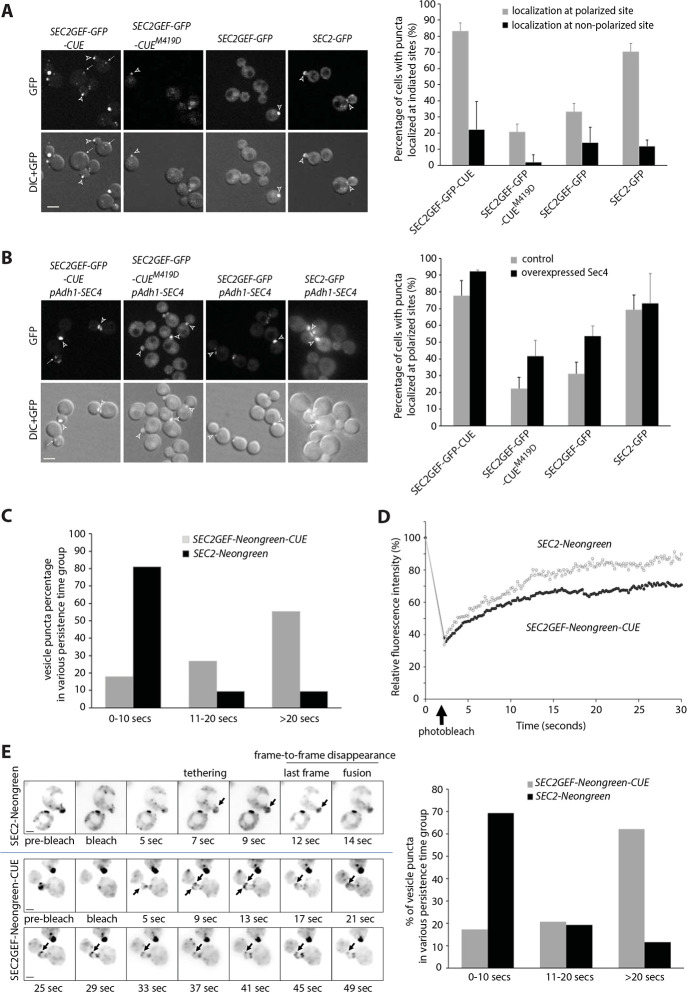
Sec2GEF-GFP-CUE and Sec2GEF-Neongreen-CUE localize to polarized sites with reduced dynamics and overexpression of Sec4 enhances the localization of Sec2GEF-GFP or Sec2GEF-GFP-CUEM419D at polarized sites. (A) Shown are GFP images and DIC images overlaid with GFP images of representative cells grown to early log phase in SC medium at 25°C. The strains examined are sec2Δ containing an integrated plasmid expressing full length Sec2-GFP, Sec2GEF-GFP, Sec2GEF-GFP-CUE or Sec2GEF-GFP-CUEM419D from the Adh1 promoter. Open arrowheads and arrows point to puncta localized at polarized sites including bud tip or bud neck and at non-polarized sites, respectively. Bars, 5μm. Sec2-GFP, Sec2GEF-GFP, Sec2GEF-GFP-CUE or Sec2-GEF-GFP-CUEM419D puncta localization at polarized or non-polarized sites was quantified and shown on the right panel. The error bars in the graph are the SD from three independent experiments. (B). Representative images of GFP-label, mCherry-Sec4, merged and overlay DIC with merged images in SEC2GEF-GFP-CUE, SEC2GEF-GFP-CUEM419D, SEC2GEF-GFP or SEC2-GFP strains as indicated on the left panel. Bar, 5 μm. Open arrowheads and arrows point to GFP puncta localized at polarized sites and non-polarized sites, respectively. The localization of Sec2GEF-GFP-CUE, Sec2GEF-GFP-CUEM419D, Sec2GEF-GFP and control Sec2-GFP at polarized sites in absence or presence of overexpressed Sec4 was quantified and shown on the right panel. Sec2-GFP is well localized at polarized sites and Sec4 overexpression doesn’t affect it. (C). Early-log phase cells expressing Sec2-Neongreen or Sec2GEF-Neongreen-CUE as the sole copy of Sec2 under Adh1 promoter were analyzed by time-lapse fluorescence imaging for 90 seconds (see Movie S1 and Movie S2). The persistence time (in seconds) of identified vesicle puncta in wild-type SEC2-Neongreen cells (n=26) and mutant SEC2GEF-Neongreen-CUE cells (n=29) was determined as described in Materials and methods. Since the acquisition time is a total of 90 seconds and more than 50% of the puncta tracked in SEC2GEF-Neongreen-CUE cells persisted until the end of acquisition, we describe the vesicle dynamics using the percentage of vesicle puncta in various persistence time groups. (D). FRAP experiments showing the normalized fluorescence intensity in the entire small bud for tagged full length Sec2-Neongreen or Sec2GEF-Neongreen-CUE (see Movie S3 and Movie S4). The original fluorescence intensity (time = 0 sec) is normalized to 100% before photobleaching and during the time-lapse acquisition the cells selected are photobleached (time = 2sec, marked by the arrow). Plotted points represent the mean value of five replicate samples each. The photobleach and FRAP experimental details are described in Materials and methods. (E). Still frames of a typical vesicle tracking experiment after FRAP in wild-type SEC2-Neongreen or SEC2GEF-Neongreen-CUE cells. An inverted monochrome maximum projection is shown for clarity. Arrows point to Sec2-Neongreen or Sec2GEF-Neongreen-CUE puncta tethered to the membrane (See also Movie S5 and Movie S6). Bar, 2um. Using Kymograh to measure the persistence time (likely from tethering to fusion) of the vesicle puncta shown by the arrows in left panel. The quantification was done in wild-type SEC2-Neongreen cells (n=42) and mutant SEC2GEF-Neongreen-CUE cells (n=56), and the percentage of vesicle puncta in various persistence time groups are shown in right panel.

