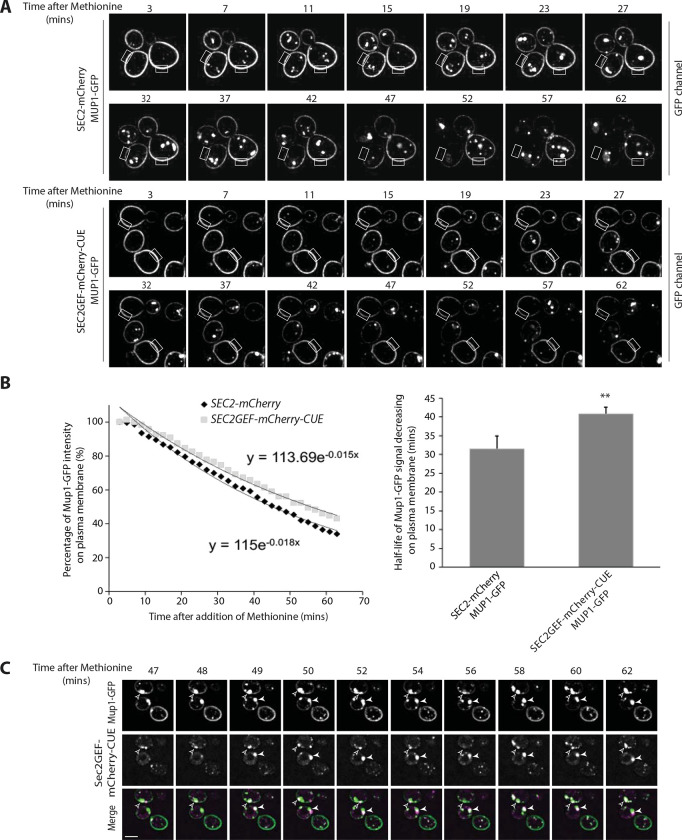
Figure 6.
Endocytosis is slow in SEC2GEF-mCherry-CUE cells and following internalization Mup1-GFP transiently colocalizes with Sec2GEF-mCherry-CUE. (A). Live-cell fluorescence microscopy of Mup1-GFP expressed from the chromosomal locus after the addition of 20μg/ml methionine to stimulate internalization of Mup1-GFP from the plasma membrane and transport to the vacuole lumen in SEC2-mCherry (upper panel) or SEC2GEF-mCherry-CUE (lower panel) cells (also see Movie S7 and Movie S8). Representative images at indicated time point have been displayed and fluorescence intensity for the rectangle selection area were used for quantitation. (B). Relative fluorescence intensity of Mup1-GFP at the plasma membrane was quantified and plotted over time (left panel). Best-fit curves represent a single-exponential decay with one rate of loss from the plasma membrane. The half-times of Mup1-GFP signal decrease on the plasma membrane were 31.5±3.4 s (SEC2-mCherry, n=7) and 40.8 ± 1.7 s (SEC2GEF-mCherry-CUE, n=7) as shown on right panel. **, P < 0.01. (C). Still frames of representative cells during Mup1-GFP endocytosis at indicated time points following the addition of 20μg/ml methionine in the SEC2GEF-mCherry-CUE strain. Open and closed arrowheads indicate concentrated Mup1-GFP puncta adjacent to the vacuole at which Sec2GEF-mCherry-CUE completely colocalizes or partially overlaps with it. Bar, 5 μm.

