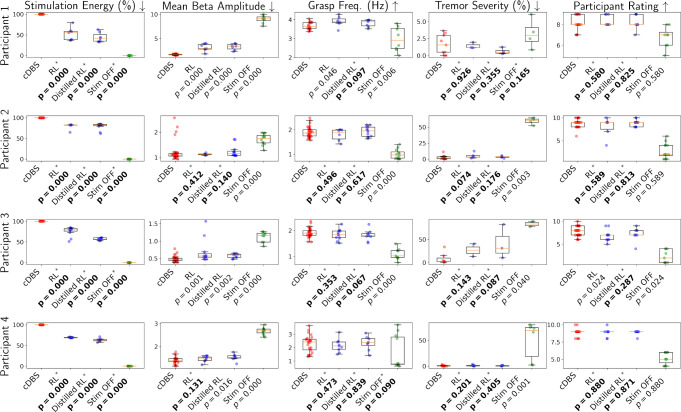
Figure 6:
Quality of control (QoC) results from all clinical trials across participants. Wilcoxon rank-sum tests [43] between cDBS and each of the other controllers are used to test the null hypothesis that two sets of measurements are drawn from the same distribution, resulting in the p-values reported above. The null hypothesis is rejected when consider the stimulation energy consumed by both RL controllers, illustrating that they lead to significant energy reduction compared to cDBS. For all other QoCs, the null hypothesis is accepted in majority cases, showing that both RL controllers can in general attain similar control efficacy to cDBS. The controllers that lead to the acceptance/rejection of the null hypothesis in the desired direction are highlighted with asterisks and bold p-values.

