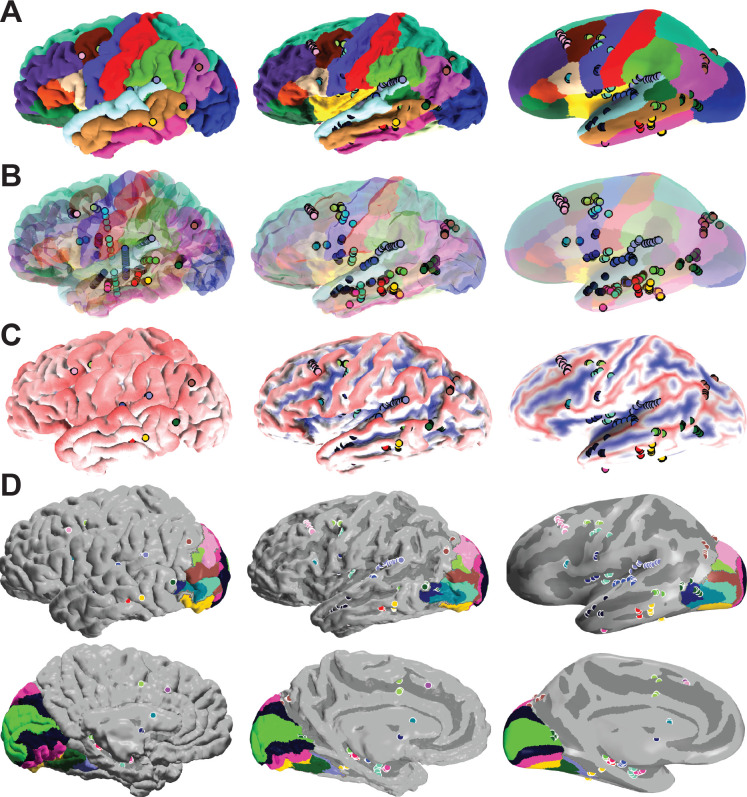
Fig. 2. Example of an SEEG subject being morphed from the 3D Surface to the inflated model.
Three different visualizations of the same subject at different morphing steps. (A) Reconstructed and labeled surfaces, including implanted electrode locations. As can be seen here, without inflation, almost non of the implanted electrodes can be visualized as the gyrated surface hides them. As we inflate the surface, we can visualize electrodes recording sulcal activity. (B) Semi-transparent reconstructed cortical surface including implanted electrode trajectories. While a semi-transparent surface allows visualization of deeper electrodes, identifying the anatomical position of an implanted electrode is challenging. (C) In this view, the gyri are labeled in red, and the sulci are labeled in blue. As expected, in the uninflated view, no sulci are visible. (D) Visualization of visual fields from a lateral (top) and medial (bottom) view. Locations of electrodes within PHC1 (dark blue, top) and V1v (neon green, bottom) can only be identified after inflating the cortex.

