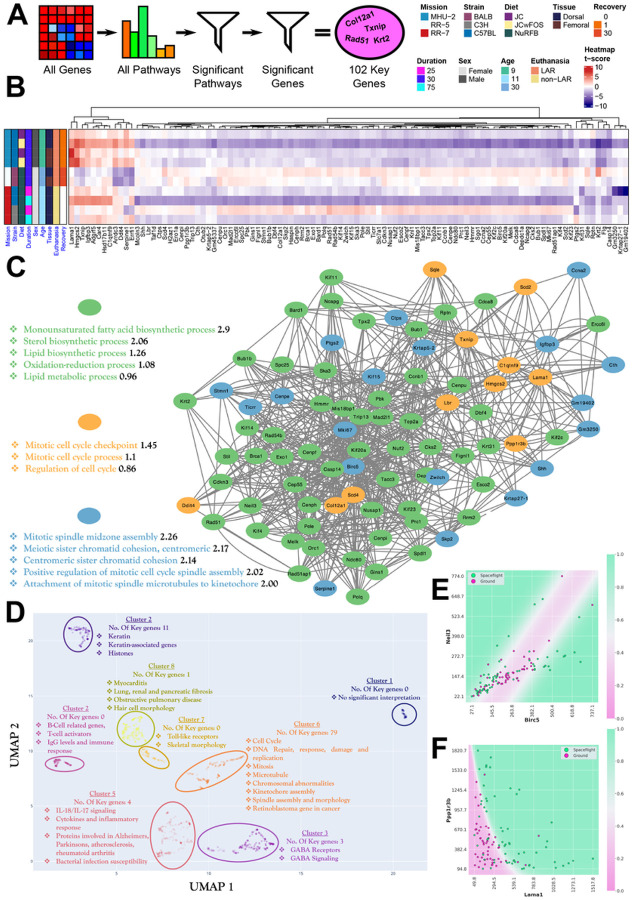
Figure 3. Key genes involved in rodent skin Spaceflight response.
A) A graphical representation of the method for deriving the set of 102 key genes pathways, where highly significant (FDR ≤ 0.05) pathways in at least 8/10 data subsets were selected and then leading-edge genes that were significant (FDR ≤ 0.1) in at least 2 datasets from different missions were accepted. B) A heatmap showing regulatory changes in the key genes within each rodent data subset. C) Shows the graph resulting from linking every gene (visualized as a node) to its five top synergistic partners, as described in the main text and the methods section. We also show the three most significant functional clusters obtained through PPI analysis. D) Shows a functionally clustered set of 1060 genes, in which all key genes have been manually added to visualize the functional correlations present in the key gene sets and how they relate to other highly variable genes. E) Shows the decision boundary of the key gene model with the largest synergistic effect between two genes. F) Shows the decision boundary of the model with the highest predictive performance overall using only two genes. Both models have plausible biological interpretations, as outlined in the text.

