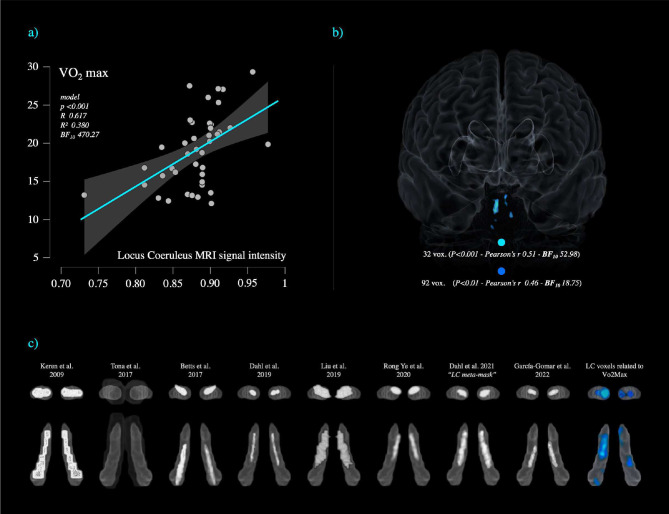
Figure 3 -.
a) shows the relationship between vo2max and Locus Coeruleus signal intensity in a sample of 41 healthy subjects (age range 60–72). Results are covaried for Age, Gender, Education, Total Intracranial Volume and max heart rate for P<0.001*. b) The significant LC voxels for P<0.01 and P<0.001 clusters are displayed in a 3D-reconstruction of the brain from a midline frontal point of view. c) The LC clusters associated with Vo2max are shown in comparison with the previously published LC atlases and masks displayed on the LC omni-comprehensive mask by Plini et al. 2021.

