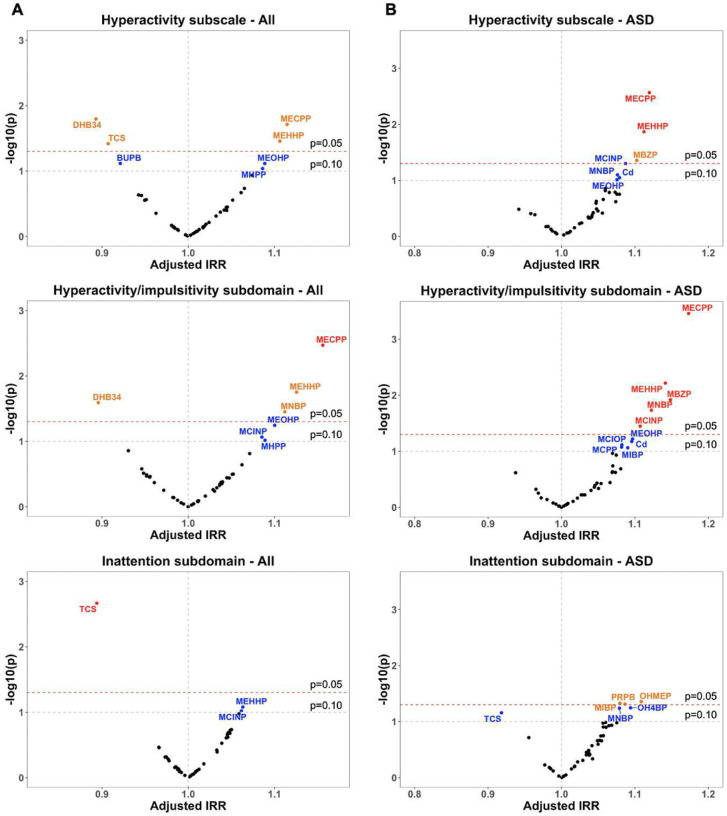
Figures 1.
Volcano plots of covariate-adjusted IRRs and unadjusted p-values of SG-corrected, In-transformed, and standardized urinary chemical concentrations in association with ABC Hyperactivity subscale and two subdomain scores (A) among all children (n=574) and (B) children with ASD (n=232). Red dots represent chemicals with an unadjusted p<0.05 and an FDR-corrected p<0.10, orange dots represent chemicals with an unadjusted p<0.05, and blue dots represent chemicals with a 0.05<unadjusted p <0.10. Negative binomial regression models were adjusted for child’s sex, birth year, and age at assessment, parity, parental education, and maternal metabolic conditions. Models for all children were additionally adjusted for child’s diagnosis.

