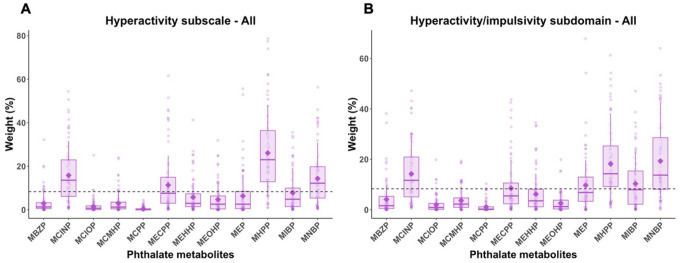
Figures 2.
Estimated weight distributions of urinary phthalate metabolites from 100 repetitions of weighted quantile sum (WQS) regression for (A) Hyperactivity subscale and (B) hyperactivity/impulsivity subdomain, adjusting for child’s sex, birth year, and age at assessment, parity, parental education, maternal metabolic conditions, and diagnostic outcomes. Boxes indicate 25th, 50th, and 75th percentiles, and diamonds indicate mean, and whiskers indicate 10th and 90th percentiles of weights. Dashed line indicates a threshold (1/# of chemicals in the mixture).

