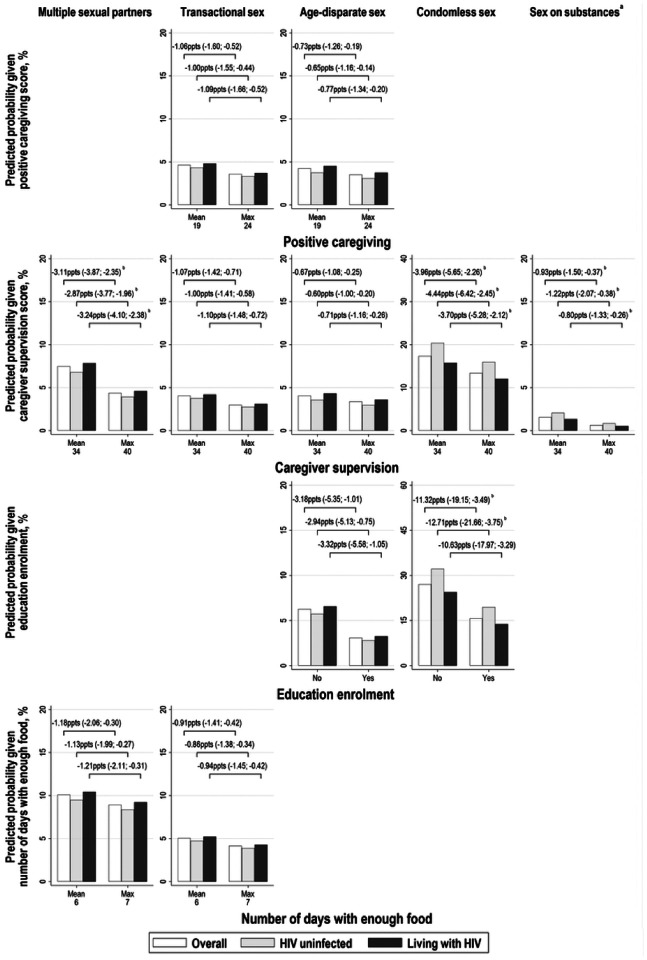
Figure 2. Predicted probabilities of HIV risk practices and probability differences comparing two scenarios among females: (i) in the absence of education enrolment, or at the mean of number of days with enough food, positive caregiving, and caregiver supervision scores; and (ii) in the presence of education enrolment, or at the maximum of number of days with enough food, positive caregiving, and caregiver supervision.
Lines connecting bars summarise the calculated difference between two predicted probabilities with 95% confidence intervals in brackets. We only calculated adjusted probabilities where there was evidence of significant associations between structural factors and lower odds of multiple HIV risk practices. Predicted probabilities were also calculated fixing HIV status covariate to “0. Not living with HIV” and “1. Living with HIV”. Values used to build Figure 2 are summarised in Table S11. aSex on substances was only measured at wave two and wave three. bPredictions are based on between-person effects rather than combined effects. Abbreviations: ppts, percentage points.

