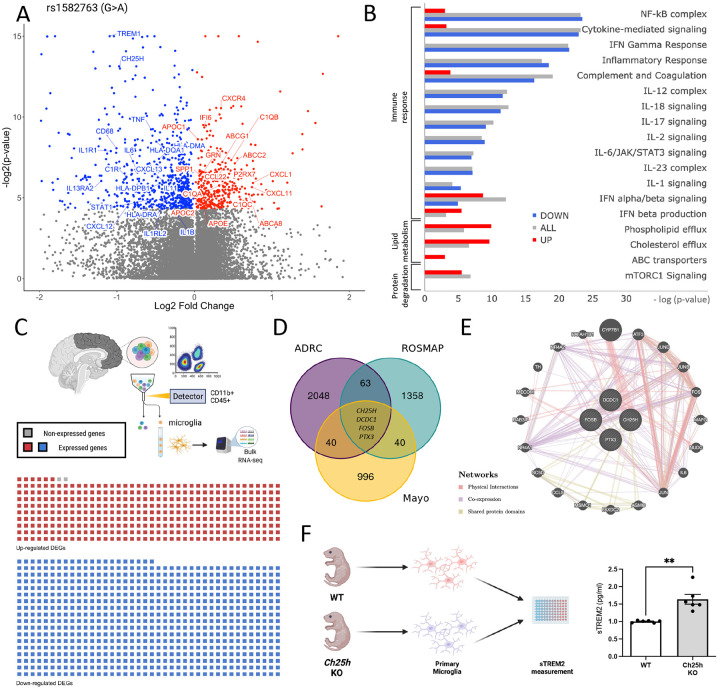
Figure 2. Brain transcriptomics reveals that the AD protective variant rs1582763 reduces the inflammatory response and increases lipid metabolism pathways.
A. Meta-analysis of the impact of rs1582763 on gene expression in 3 independent brain cohorts. Volcano plot of genes that are differentially expressed in the presence of rs1582763. B. Pathway analysis reveals genes enriched in pathways related to immune signaling and lipid metabolism. Red, up-regulated genes. Blue, down-regulated genes. Gray, all differentially expressed genes. C. Sorted brain microglia (ROSMAP; n=10 brains) were queried to determine whether identified DEGs were enriched in microglia. The waffle plot illustrates the number of genes present in FACS-isolated microglia. Red, up-regulated genes. Blue, down-regulated genes. Gray, absent in the microglia dataset. D. Venn diagram shows the number of differentially expressed genes within three independent cohort (FDR < 0.05). Covariates include age, sex and disease status. E. Gene network diagram reveals the relatedness of CH25H, DCDC1, FOSB, and PTX3. Network: Red, physical interaction. Purple, co-expression. Olive, shared protein domain. F. Schematic of primary microglia culture from WT and Ch25h KO mice. Primary mouse microglia from Ch25h KO mice display significantly higher sTrem2 levels in the media detected by ELISA (p = 1.0 x 10⁻³).

