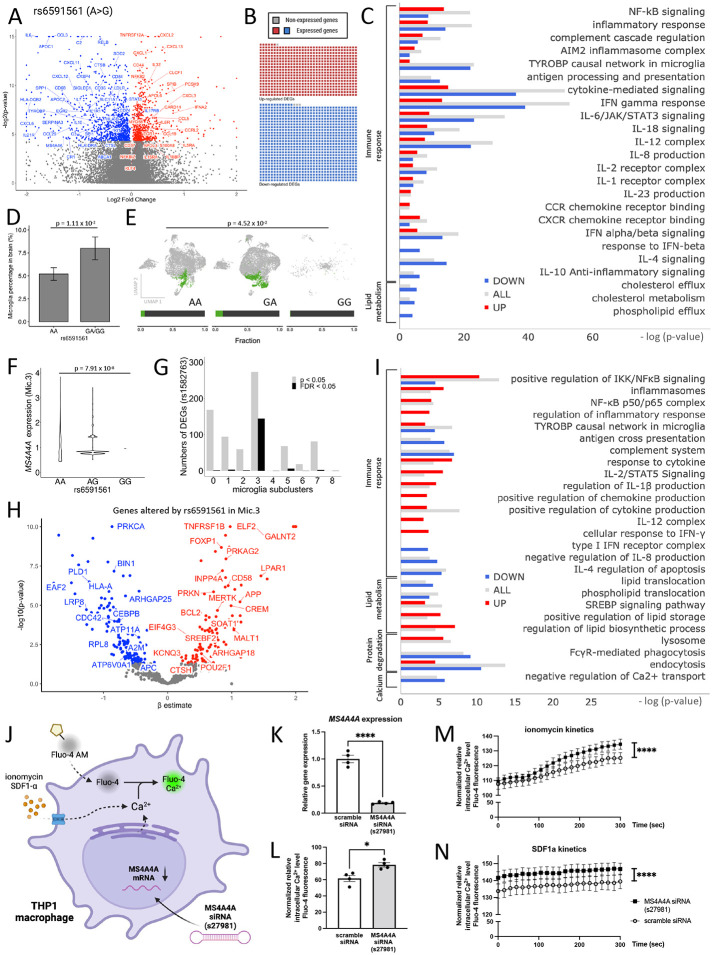
Figure 4. The AD risk variant rs6591561 is associated with upregulation of inflammasome and inflammatory cytokines and reduced lipid metabolism.
A. Meta-analysis of the impact of rs6591561 on gene expression in three independent brain cohorts. Volcano plot of genes that are differentially expressed in the presence of rs6591561. B. Sorted brain microglia (ROSMAP; n=10 brains) were queried to determine whether genes identified in (A) were enriched in microglia. The waffle plot illustrates the number of genes present in sorted microglia. Red, up-regulated genes. Blue, down-regulated genes. Gray, absent in the microglia dataset. C. Pathway analysis of genes from (A) reveals genes enriched in pathways related to immune signaling and lipid metabolism. Red, up-regulated genes. Blue, down-regulated genes. Gray, all differentially expressed genes. D. Single nucleus RNA-seq reveals that rs6591561 is associated with an increased microglia proportion (LR, p = 1.11 x 10⁻²). E. UMAP reveals a significant increase in the proportion of a specific microglia population of microglia (Mic.3) in the presence of the minor allele of rs6591561 (LR, p = 4.52 x 10⁻²). F. MS4A4A expression is reduced in minor allele carriers of rs6591561 in Mic.3 (ANOVA, p = 7.91 x 10⁻⁸). G. Bar graph of the number of genes differentially expressed as a function of the rs6591561 genotype across microglia subpopulations reveals that differentially expressed genes are enriched in Mic.3. Gray, p<0.05. Black, FDR<0.05. H. Volcano plot reveals genes differentially expressed based on the rs6591561 genotype in Mic.3. I. Pathway analysis reveals that rs6591561 alters genes involved in elevated inflammasome, inflammatory cytokines, enhanced lipid storage, and decreased lipid metabolism in Mic.3. J. Schematic representation of Fluo-4 calcium assay on THP-1 macrophage treated with MS4A4A siRNA (s27981). K. qPCR reveals MS4A4A is significantly reduced in the presence of MS4A4A siRNA. L. Baseline intracellular Ca2+ levels are elevated after treatment with MS4A4A siRNA s27981. M. Intracellular Ca2+ kinetics after treated with SDF1α. N. Intracellular Ca2+ kinetics after treated with ionomycin ****, p<0.0001.

