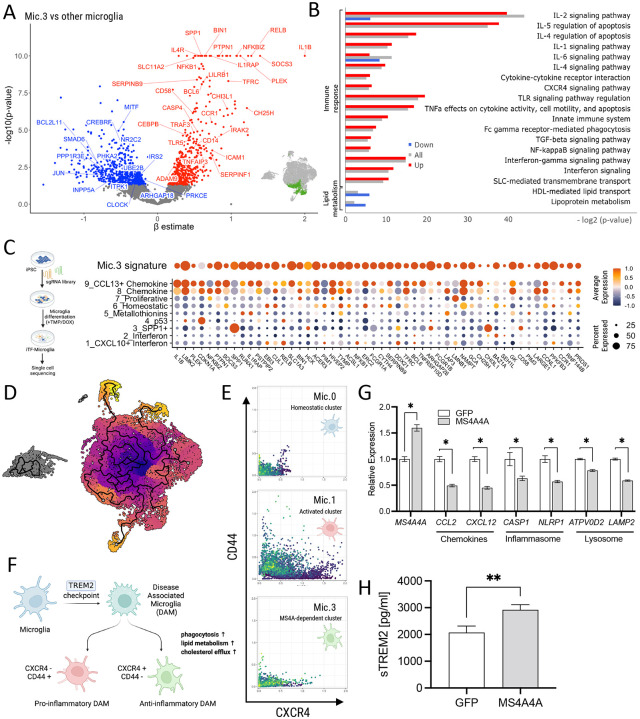
Figure 5. Variants in the MS4A locus shift microglia identity.
A. A volcano plot illustrates differentially expressed genes between Mic.3 and all microglia subclusters. The inset graphic shows the reference location of Mic.3. B. Pathway analysis reveals enrichment of genes associated with chemokines, immune/inflammatory response and lipid metabolism. Red, upregulated DEGs. Blue, downregulated DEGs. Gray, all differentially expressed genes. C. (Left) A graphic illustration shows CROP-seq from iTF-microglia. (Right) A dot plot shows the expression level of the top 50 Mic.3 differentially expressed genes in Knight ADRC brain microglia and iTF-microglia. Average expression indicated by color scale. Percent expressed illustrated by the size of the circle. D. An UMAP diagram shows homeostatic (Mic.0), activated (Mic.1) and MS4A4A-dependent (Mic.3) microglia clusters trajectory by Monocle 3. E. Scatterplots show imputed relative expression of CXCR4 (anti-inflammatory)/CD44 (pro-inflammatory) in homeostatic (Mic.0), activated (Mic.1), and MS4A4A-dependent (Mic.3) microglia cluster generated by MAGIC. F. A hypothesis proposes that disease-associated microglia (DAM) differentiate into the pro-inflammatory DAM and the anti-inflammatory DAM. G-H. Peripheral blood mononuclear cell (PBMC) derived macrophages were transduced with lentivirus particles carrying GFP or MS4A4A WT. G. RNA expression levels of MS4A4A, chemokine, inflammasome, and lysosomal genes were plotted. H. sTREM2 levels in media from GFP or MS4A4A-encoding lentiviral transduced macrophages. *, p < 0.05; **, p < 0.001.

