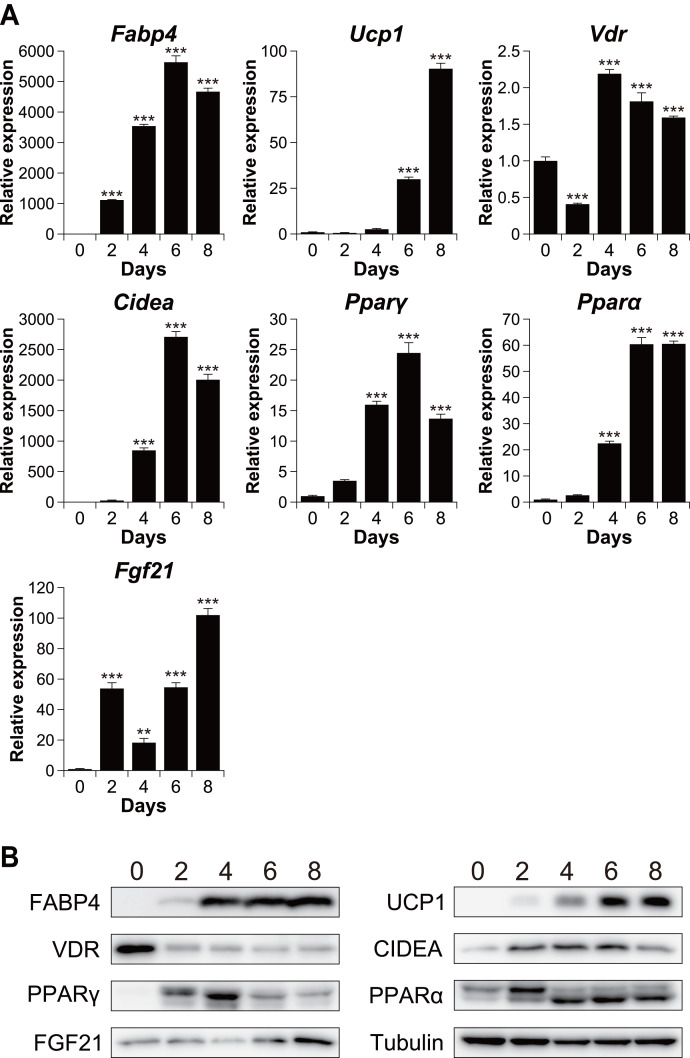
Figure 1. Time course analysis of mRNA and protein expression during brown adipocyte differentiation of C3H10T1/2 cells.
(A) mRNA expression of Fabp4, Ucp1, Vdr, Cidea, Pparγ, Pparα, and Fgf21, as measured using quantitative reverse transcription-polymerase chain reaction (n = 4). (B) Protein expression of FABP4, UCP1, VDR, CIDEA, PPARγ, PPARα, FGF21, and α/β-tubulin, as measured using western blot analysis. Data are shown as mean ± standard error of the mean. ** p < 0.01, *** p < 0.001 versus day zero.

