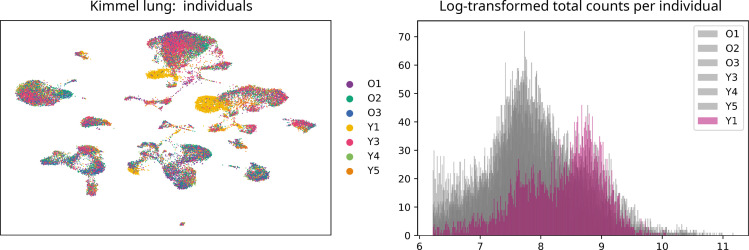
Appendix 4—figure 1. Uniform manifold approximation and projection plot showing the samples from the seven individuals present in the Kimmel lung dataset.
Even though most cells cluster together according to their cell type rather than by individual, samples from donor Y1 cluster together. We observed that there was a big batch effect between this and the rest of the individuals. Histogram showing the log-transformed total number of counts/cell per individual mice. The distribution of counts/cell of the samples from mouse Y1 is very different to the rest of the samples. This difference could not be overcome using the batch-effect correction tool bbknn. Downsampling the counts so that the number of counts/cell was balanced across individual mice did not solve the problem either. Therefore, we decided to discard the samples Y1L1 and Y1L2.

