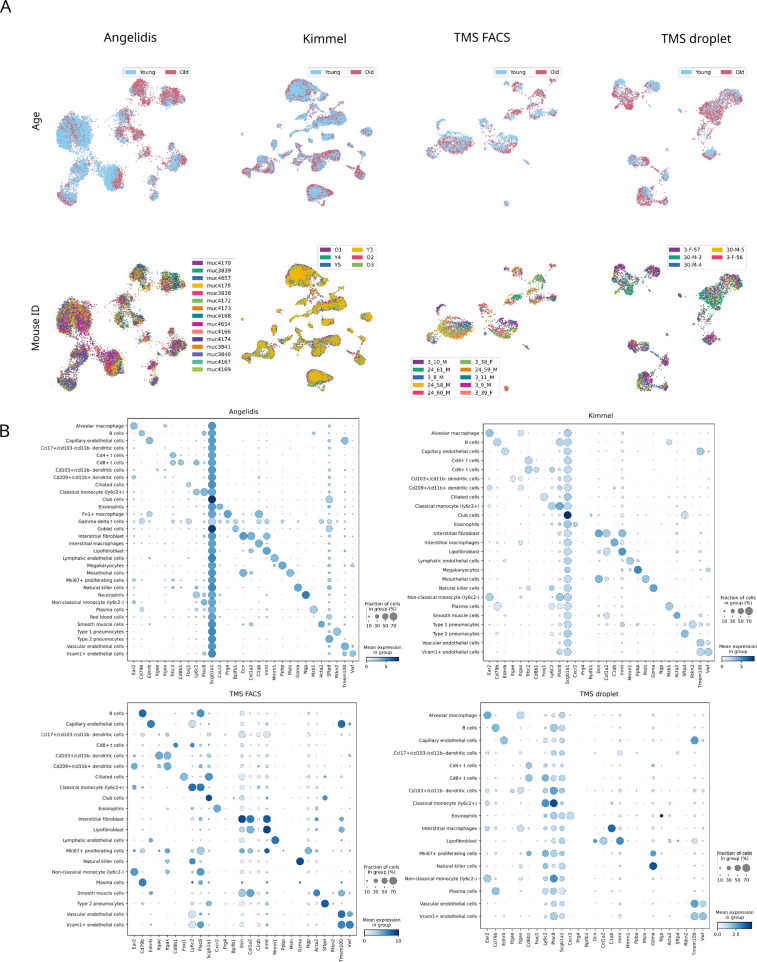
Appendix 5—figure 1. Murine aging lung datasets: sample composition and cell type marker expression.
(A) There are no mouse- or age-related batch effects. Uniform manifold approximation and projection plots of the four aging lung datasets showing the age and mouse labels. Cells cluster according to their cell type rather than to their age group or individual mouse. (B) Expression of lung cell type markers by each annotated cluster. The dotplots show the expression of the cell type markers from Angelidis et al., 2019 on the four annotated lung datasets. The size of the dots represents the fraction of cells expressing one particular marker in the group of cells assigned a particular cell type label. The color represents the level of expression of the marker in that group averaged over the cells that have a positive expression of that marker.

