Figure 3. Lack of evidence for an increase in transcriptional noise of the murine aging lung and detection of an enrichment in immune cells.
(A) Bubble chart of transcriptional noise and cell type enrichment (old/young odds ratio [OR]) of 31 murine lung cell identities. The age-related change in transcriptional noise (horizontal axis) is computed by Scallop as the decrease in median membership score per cell identity between young and old cells. The enrichment of each cell type in old samples with respect to their young counterpart is represented as the old/young OR (vertical axis). The area of the bubbles represents the expected proportion of each cell type in the whole dataset according to the binomial generalized linear model fitted for that dataset. (B) Immune cell type enrichment but not age-associated increase in transcriptional noise, is consistently detected in old mice lungs. The increase in transcriptional noise associated with aging (left) and the cell type enrichment (right) are shown for several lung cell identities classified on the left as immune and non-immune. Cell identities present in at least three out of the four studied datasets are shown, and the age-related difference in transcriptional noise of missing cell identities is imputed from the remaining three measurements (mean difference across datasets).

Figure 3—figure supplement 1. Composition of the four single-cell RNA sequencing datasets of the murine aging lung used in this figure.

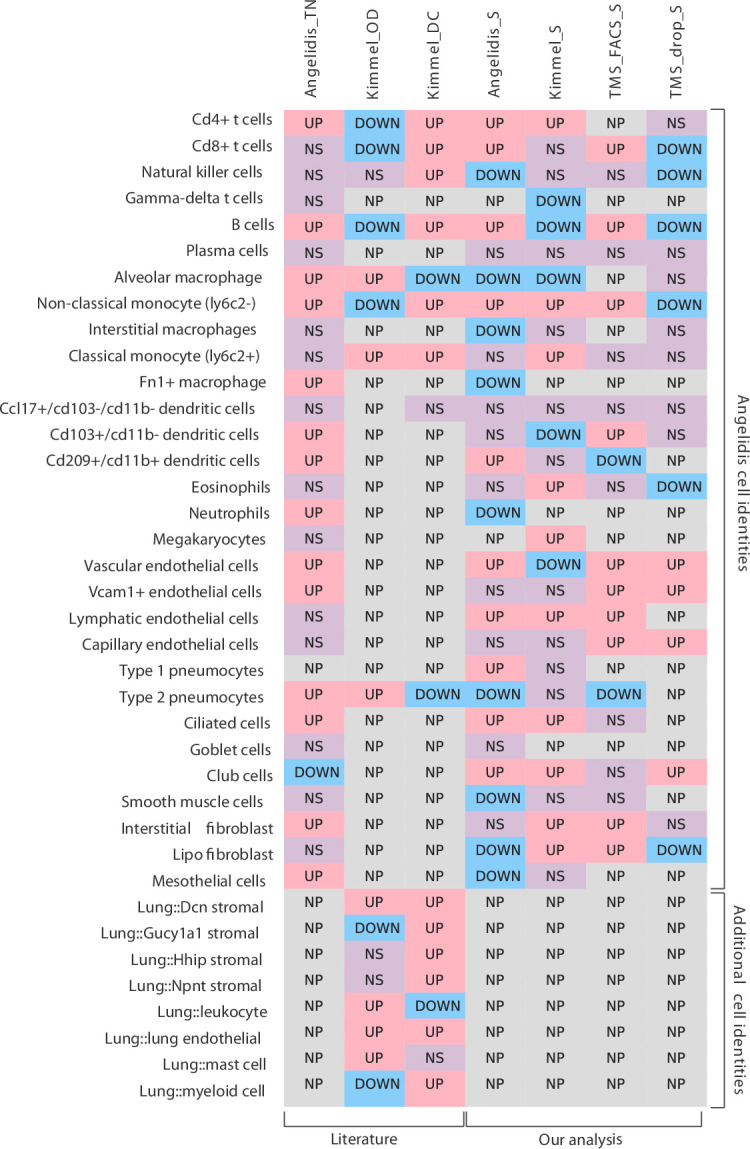
Figure 3—figure supplement 2. Qualitative ranking of murine aging lung cell types according to transcriptional noise and cell type enrichment.

Figure 3—figure supplement 3. Comparison of the originally reported cell type-associated increase in transcriptional noise with the results obtained with Scallop.