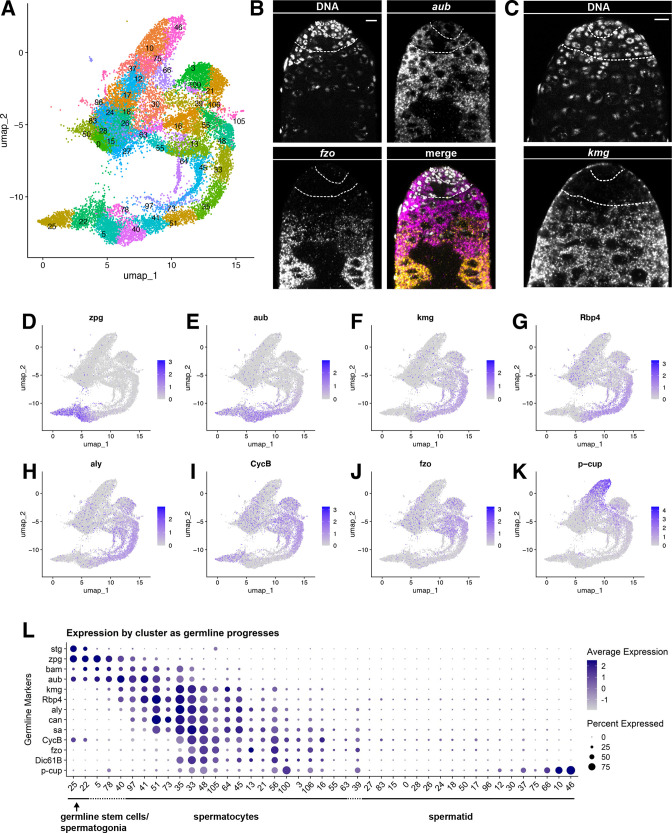
Figure 2. Characteristics of the germline lineage.
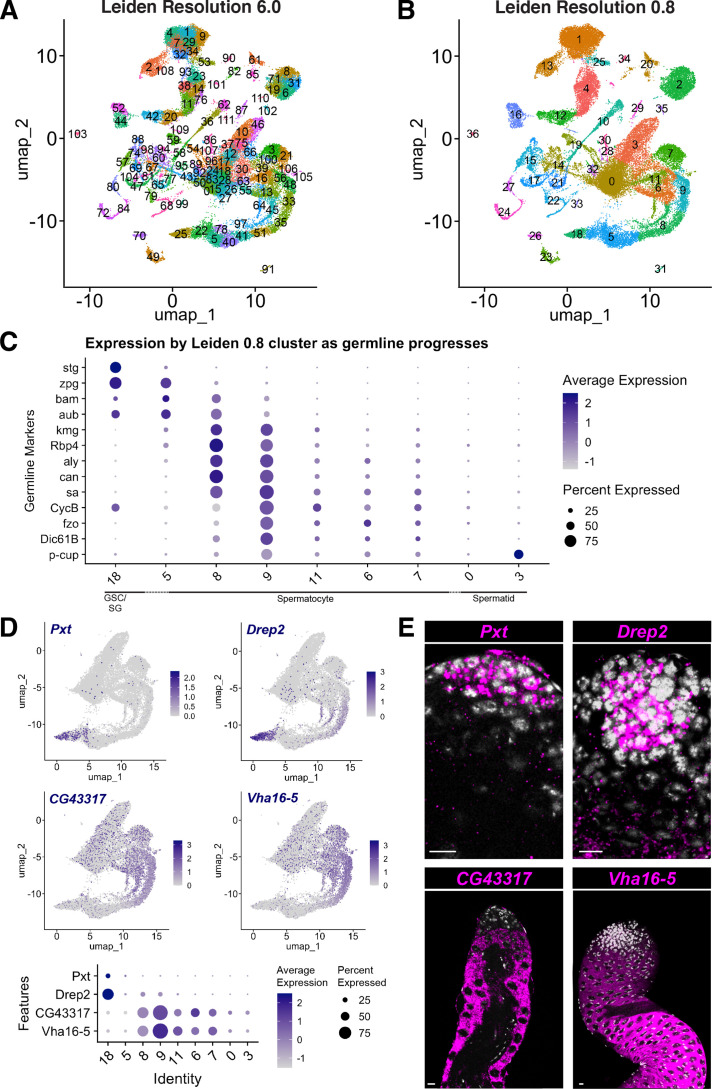
(A) Germline portion of the UMAP generated by Seurat from clustering of the full testis plus seminal vesicle dataset at Leiden 6.0 resolution. (B–C) Apical tips of testes showing localized expression of (B) aub (magenta) and fzo (yellow) mRNA and (C) kmg mRNA visualized by in situ hybridization. Apical-most dotted line demarcates germ line stem cells (GSCs) around the hub from spermatogonia. Lower dotted line demarcates spermatogonia and cells in premeiotic S phase from young spermatocytes. Scale bars, 10 µm. (D–K) Feature plots generated by Seurat showing expression levels of zpg, aub, kmg, rbp4, aly, CycB, fzo, and p-cup in the germline UMAP. Navy blue gradient bars: relative expression level for the indicated gene. (L) Dot plot generated by Seurat showing expression levels of selected germline markers by cluster as nuclei progress from spermatogonia to spermatid. Color intensity: level of expression of the indicated gene averaged over all the nuclei in a given cluster relative to the level for that gene in other germline clusters. Size of dots: percent of nuclei in specified cluster in which expression of the gene was detected (see also Figure 2—figure supplement 1).


