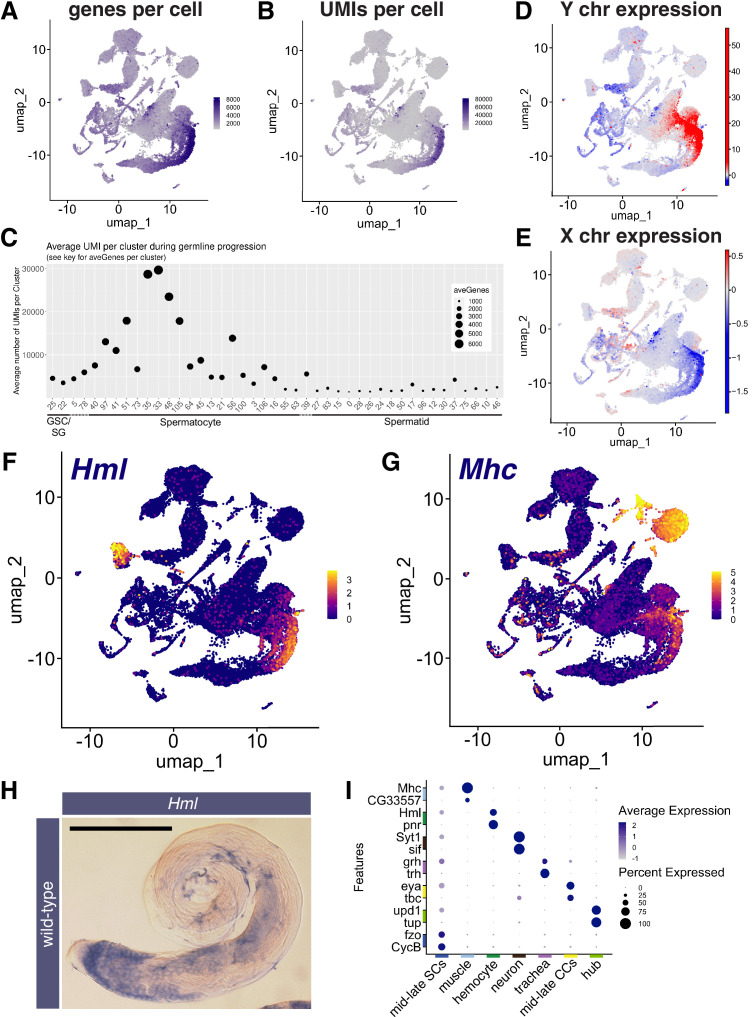
Figure 3. Features of the spermatocyte transcription program.
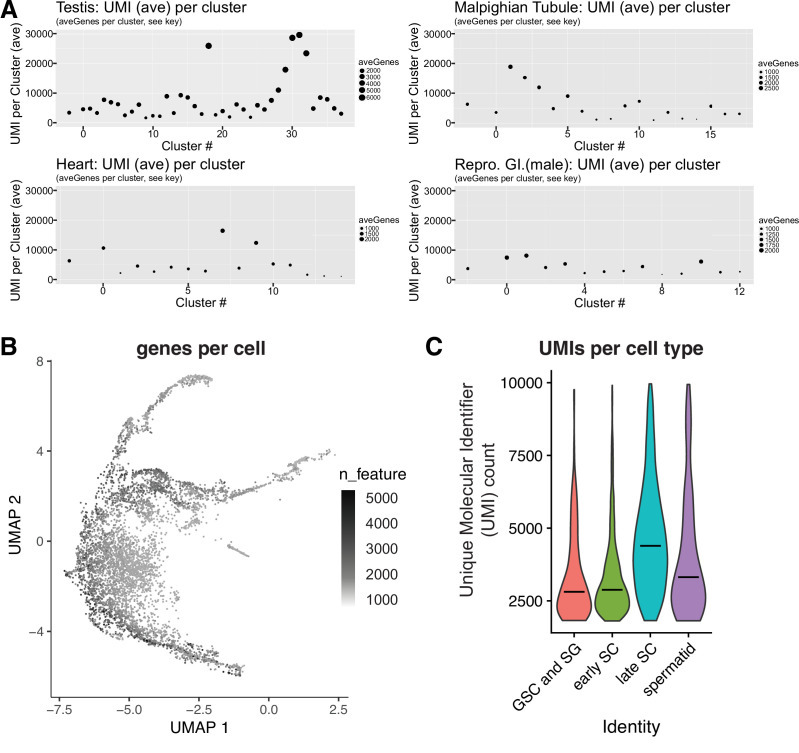
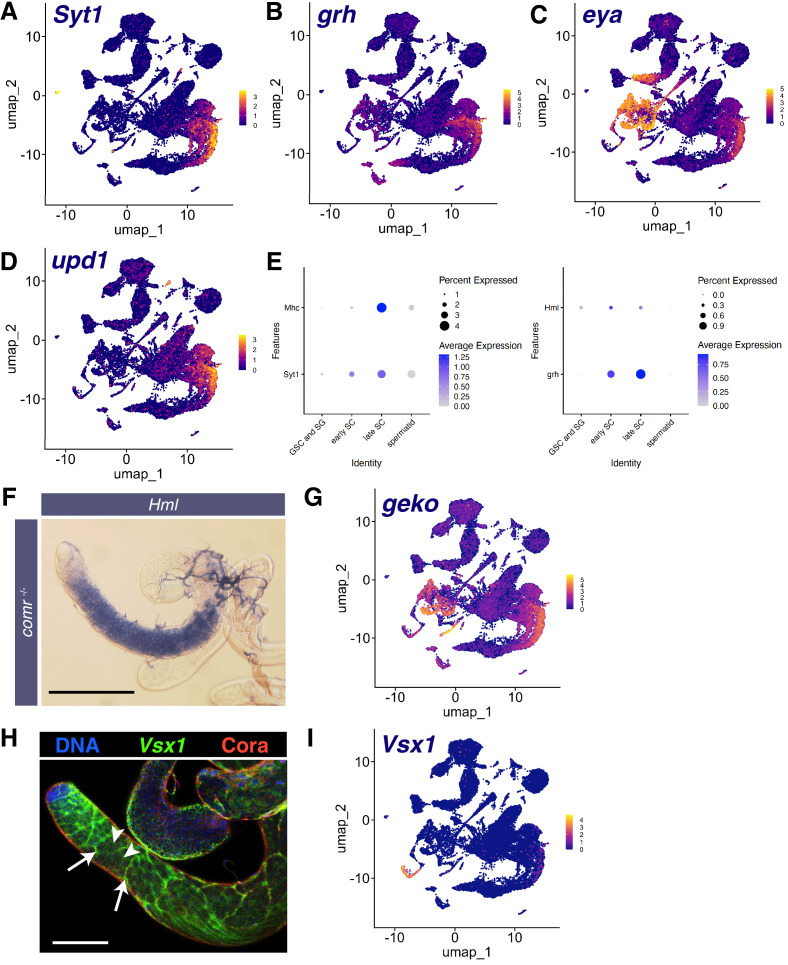
(A, B) UMAPs of snRNA-seq data showing: (A) number of genes detected as expressed and (B) Number of unique molecular identifiers (UMIs) detected per nucleus. (C) Plot of average number of genes expressed (dot size) and UMIs detected per nucleus per germline-annotated Leiden 6.0 cluster, ordered by estimated progression of germ line differentiation. (D, E) UMAPs of snRNA-seq data showing average expression of: (D) Y chromosome tor (E) X chromosome encoded transcripts relative to an expression-matched control set (gene sets with binned expression matching transcript lists). Note the dramatically different relative expression scales in (D) vs (E) UMAPs taken directly from ASAP (Li et al., 2022; Gardeux et al., 2017). (F, G) UMAP plots of snRNA-seq raw counts (log-transformed) showing expression of: (F) Hemolectin (Hml) in hemocytes and late spermatocytes and (G) Myosin heavy chain (Mhc) in muscle and late spermatocytes. Yellow: relative expression high. (H) Testis hybridized in situ with biotinylated antisense RNA probe to Hml, showing expression (blue) in spermatocytes. Scale bar, 200 µm. (I) Dot Plot showing expression of pairs of tissue specific markers across cell types in the testis plus seminal vesicle snRNA-seq sample. Average expression of each gene in a given cell type (here, a cluster at Leiden 0.4 resolution) denoted by color intensity. Percent of nuclei of the given cell type scored as expressing each gene denoted by dot size. Colors along axes (see Figure 1B) indicate the relevant cell type for tissue-specific marker pairs. (see also Figure 3—figure supplements 1 and 2 and Figure 3—source data 1).


