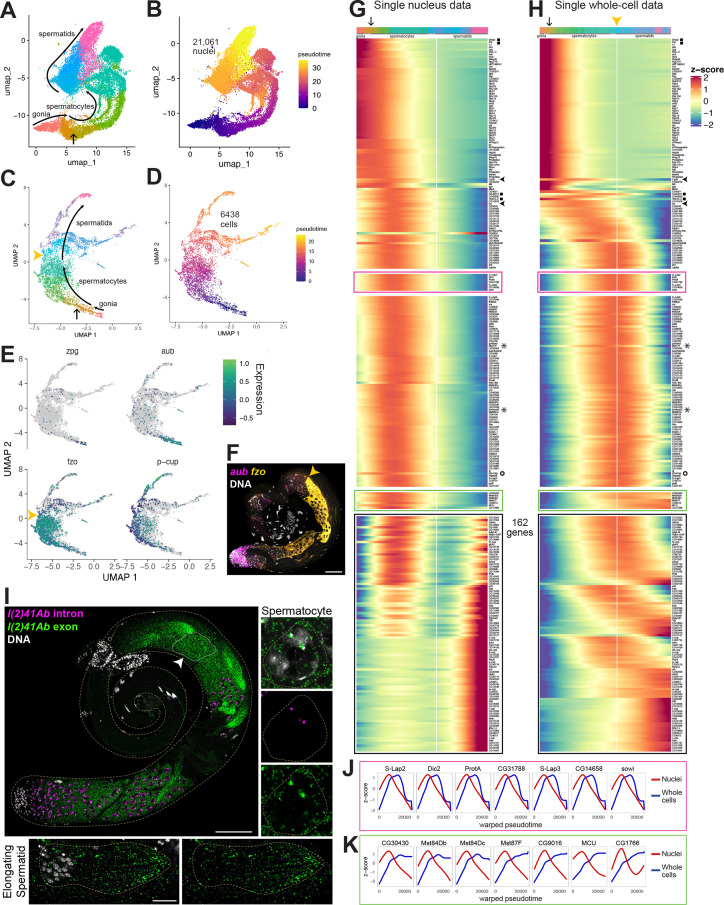
Figure 4. Developmental transitions revealed by comparing sn and scRNA-seq.
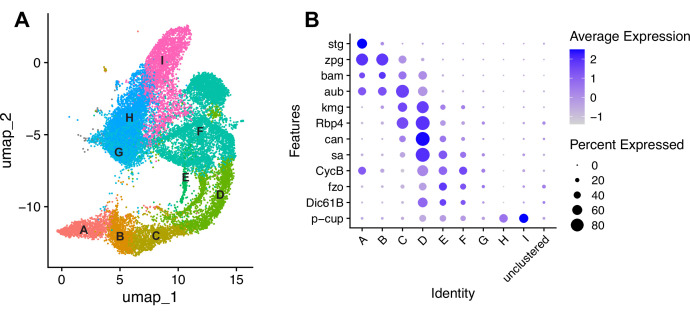
(A–D) UMAP plots of germline-annotated data from (A, B) FCA snRNA-seq of adult testis plus seminal vesicle and (C, D) whole-cell scRNA-seq of adult testis. (A, C) Color denotes germline differentiation stage, with clustering in A as in Figure 4—figure supplement 1. (B, D) Color denotes pseudotime, with the few nuclei lacking a calculable pseudotime value colored gray. (E) UMAPs of scRNA-seq data showing log10(Expression) levels of cell-stage diagnostic markers zpg, aub, fzo, and p-cup. (F) FISH of diagnostic genes aub and fzo. Scale bar, 50 µm. Yellow arrowhead in (C, F, H) marks the point at which fzo transcript drops, annotated as early round spermatids based on (F). (G–H) Heatmaps of row-normalized (z-score) gene expression over pseudotime for: (G) all germline-annotated single nuclei from panel A, (H) all germline-annotated single whole cells from panel C, with genes in same order as in G. X axes, pseudotime; Y axes, genes. Vertical white line: nuclei (G) or cells (H) where level of fzo mRNA has dropped 50% from peak to nadir (0 on Z score). Fzo transcript drop validated in the cell data, and marked with yellow arrowhead. Top bars: cell identity for each column, colored as in panels A,C. Arrow points to transition between clusters dominated by expression of genes up in spermatogonia to clusters dominated by expression of genes upregulated in early spermatocytes (see Figure 4—figure supplement 1A and B). Gene markers as follows: black filled squares, transcripts validated in Figure 2—figure supplement 1. Arrowheads, CycB and fzo. Asterisks, Mst77F and tomboy20. Circle, l(2)41Ab, validated in panel I. Black boxes: genes transcribed post-meiotically (see Figure 5). (I) FISH of l(2)41Ab intron (magenta) and l(2)41Ab exon (green). Arrowhead on whole testis points to a round spermatid cyst, which lacks intronic signal. High magnification insets: Side - Spermatocyte nucleus showing intronic and exonic probe signal. Bottom - elongating spermatid cyst showing exonic probe signal only. Scalebars: whole testis, 50 µm; spermatocyte, 5 µm; spermatid, 20 µm. (J-K) Comparison of gene expression over warped pseudotime for: (J) genes outlined by pink boxes in G,H; (K) genes outlined by green boxes in G,H. (see also Figure 4—figure supplement 1).


