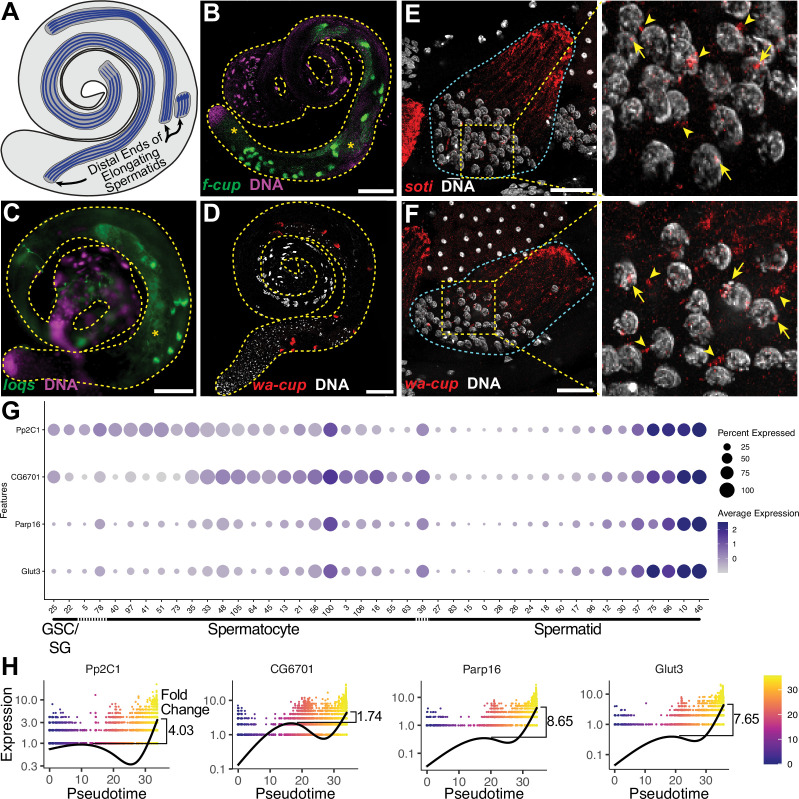
Figure 5. The transcript landscape of haploid spermatids.
(A) Diagram of spermatid orientation in the testis at different stages of spermatid elongation. Arrows: distal ends of spermatid cysts. (B, C) RNA FISH of representative transcripts (B): f-cup, (C): loqs in whole testes showing different patterns of mRNA localization for post-meiotically transcribed genes. DNA (magenta), target RNA (green). Asterisk: signal in spermatocytes as surmised by relatively large nuclear profile revealed by absence of signal. Bar: 100μm. (D) smFISH for wa-cup (red) in whole testes. DNA (white). Bar: 100μm. (E, F) Left: smFISH for soti (E) or wa-cup (F) in a single early elongating spermatid cyst (cyan dashed outline). RNA (red) and DNA (white). Bar: 25 μm. Right: Enlarged image of yellow dashed box showing spermatid nuclei. Arrows: nuclear transcripts. Arrowheads: perinuclear granules. (G) Dot plot for selected spermatid transcribed genes showing expression levels in each germ cell cluster. (H) Expression over pseudotime for selected spermatid transcribed genes and fold change between late pseudotime and previous expression maxima in early/mid pseudotime (see also Figure 5—figure supplement 1).


