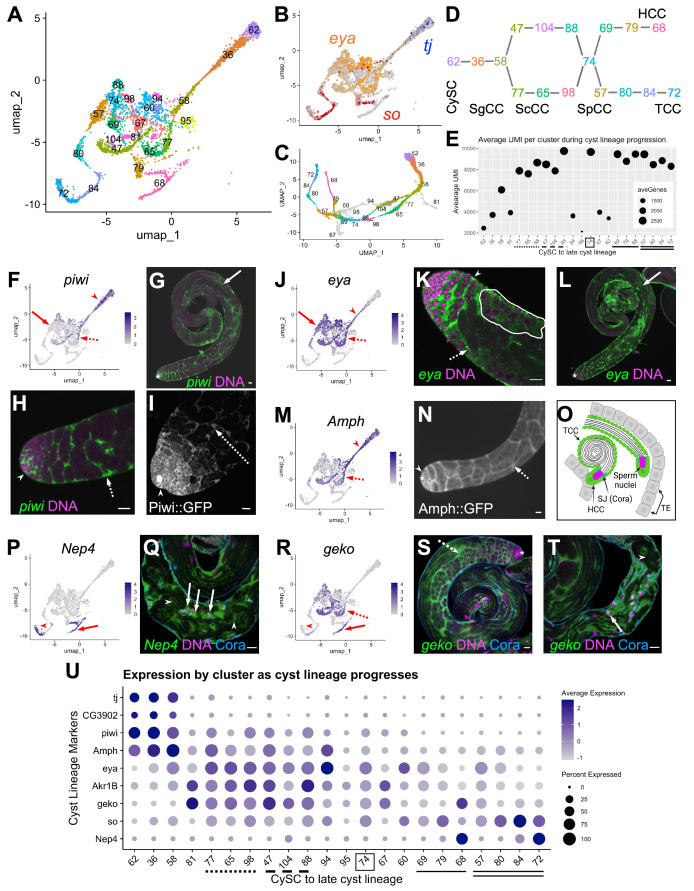
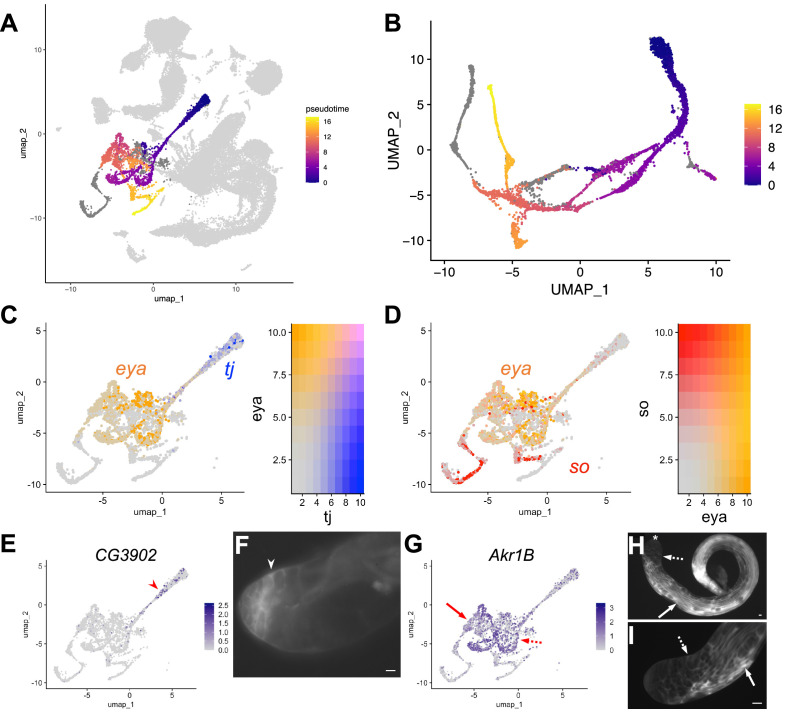
Figure 6. Differentiation in the somatic cyst cell lineage.
(A) Cyst cell lineage portion of the UMAP from snRNA-seq data with Leiden 6.0 cluster numbering. (B) Expression of tj (blue), eya (orange), and so (red) projected on the UMAP (heatmaps in Figure 6—figure supplement 1C and D). (C) 2D UMAP of cyst cell clusters newly reprojected in their own gene expression space (Materials and methods; note different axis coordinates relative to panel A). Cluster colors correspond to panel A except for unidentifiable clusters with low UMIs (gray). (D) Schematic of cyst cell cluster progression from CySC, to spermatogonia-associated (SgCC) to spermatocyte-associated (ScCC) to spermatid-associated (SpCC) inferred from the 3D UMAP in panel C. Cluster numbers and colors as in A. Note two splits, one earlier and one later in cyst lineage progression. (E) Plot of average number of genes (dot size) and average number of UMIs per cyst lineage-annotated cluster; with clusters ordered by deduced progression of differentiation. Dotted and dashed lines under cluster numbers represent the early split shown in D, while single (HCC) and double (TCC) solid lines represent the later split. (F - T) UMAPs compared to FISH (RNA), IF or live GFP emission (from tagged protein) images. For each gene comparison, arrows, dashed arrows and/or arrowheads point out the same cell type in the UMAP and its corresponding FISH and/ or GFP fluorescence image. (F) piwi mRNA expression projected on the UMAP. (G, H) piwi mRNA (FISH; green) and DNA (magenta). (G) whole testis, (H) testis apical tip. (I) Apical tip of testis expressing GFP tagged Piwi protein. (J) eya mRNA expression projected on the UMAP. (K, L) eya mRNA (FISH; green) and DNA (magenta). (K) Testis apical tip. (L) Whole testis. Outline demarcates cyst of spermatocytes showing eya transcript expression (see Figure 3 and its supplement). (M) Amph expression projected on the UMAP. (N) Apical third of a testis expressing GFP-tagged Amph protein. (O) Schematic of head cyst cells (HCC, green solid outline) embedded (left) or not embedded (right) in the terminal epithelium (TE, gray), with the tail cyst cell (TCC, green dashed outline) extending away, containing either a pre-coiled (right) or coiled (left) spermatid bundle (Sperm nuclei, magenta). Coracle (Cora, blue) marks the septate junction (SJ) between TCC and HCC. (P) Nep4 mRNA expression projected on the UMAP. (Q) Testis base showing Nep4 mRNA (FISH, green), DNA (magenta), and Cora (septate junctions, cyan). Arrowhead points to TCCs associated with coiled sperm. (R) UMAP of geko mRNA expression. (S, T) geko mRNA (FISH, green), DNA (magenta), and Cora (septate junctions, cyan). (S) Whole testis. (T) Testis base. Arrowhead points to TCCs associated with coiled sperm. (U) Dotplot of gene expression (Y axis) by cluster as cyst lineage progresses through differentiation (X axis, left to right). Averaged expression in each cluster indicated by color scale. Percent of cells within a cluster expressing the gene indicated by size of dot. Lines under cluster numbers as in E. Asterisk denotes hub. Bars: 20 μm (see also Figure 6—figure supplement 1).


