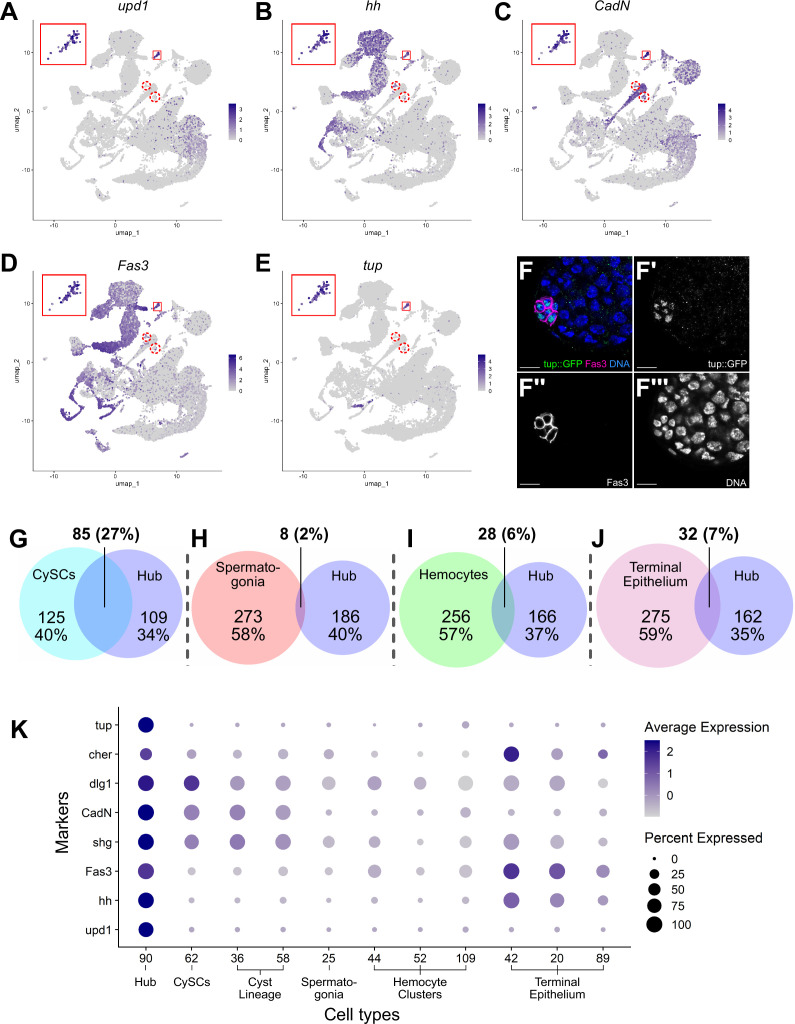
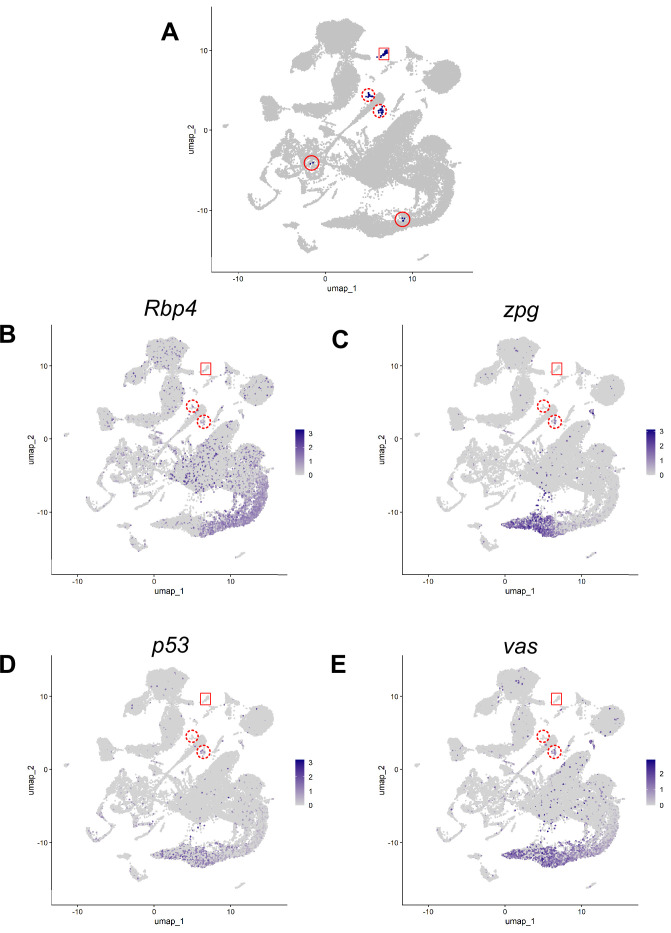
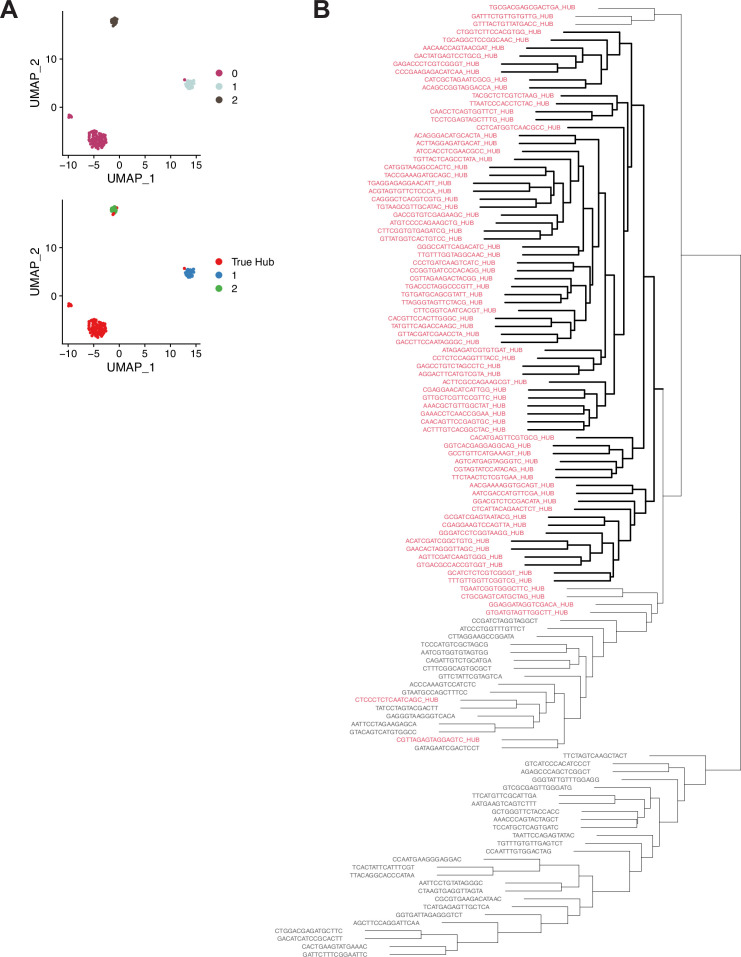
Figure 7. Characteristics of the Hub.
(A–E) Expression of the indicated genes (upd1, hh, CadN, Fas3, tup) projected onto the testis snRNA-seq UMAP with the 79 definitive hub nuclei outlined (small red box), with reprojection of hub nuclei (larger red box). Color intensity corresponds to expression level, shown as normalized average logFC. Red dashed circles contain non-hub nuclei of cluster 90 (see text and Figure 5). (F-F’’’) Apical tip of adult testis carrying a Tup::GFP fusion transgene revealing protein expression largely restricted to hub nuclei delimited by Fas3 (magenta). Nuclei (blue). Scale bar: 10 μm. (G–J) Paired Venn diagrams, comparing up-regulated genes in the hub vs. clusters containing either CySCs, spermatogonia, hemocytes, or terminal epithelial cells. Overlap in upregulated genes was greatest between Hub and CySCs. In each pairing, circle size reflects the number of genes compared for each cluster. Genes are listed in Figure 7—source data 1; the specific genes for hub vs. CySCs in Figure 7—source data 2. (K) Dot plot of expression of selected genes comparing hub to CySCs, the early Cyst lineage, Spermatogonia, Hemocytes, and Terminal epithelium (see also Figure 7—figure supplements 1 and 2).


