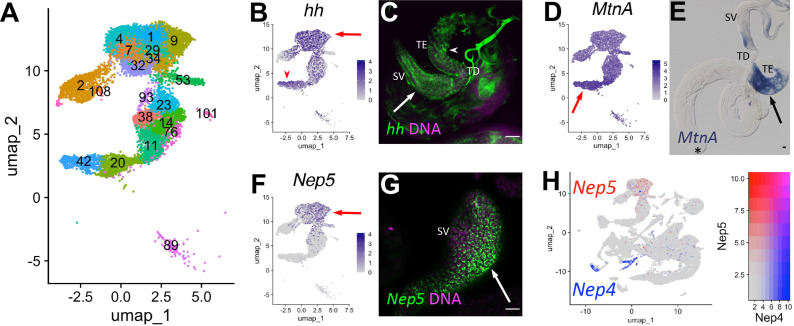
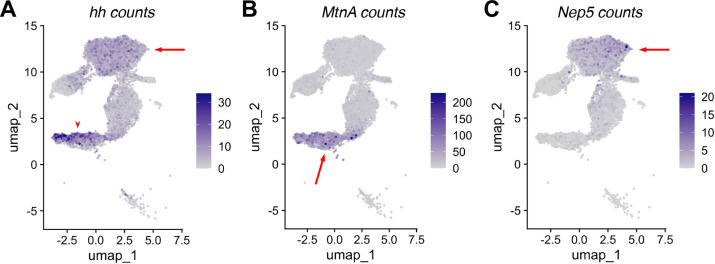
Figure 8. Characteristics of supporting epithelia.
(A) UMAP of non cyst cell lineage epithelial cells of the testis from the FCA snRNA-seq data with Leiden 6.0 clusters. Note: identity of cluster 89 remains undefined. (B - G) UMAPs compared to ISH images. For each comparison, arrows and/or arrowheads point out the same cell type in the UMAP and its corresponding ISH image. (B) hh mRNA expression projected on the UMAP. (C) FISH of hh mRNA (green) and DNA (magenta) showing the base of the testis including the TE (arrowhead), testicular duct (TD), and SV (arrow). (D) MtnA mRNA expression projected on the UMAP. (E) Colorimetric in situ hybridization of MtnA mRNA (blue) in an entire testis plus seminal vesicle. Asterisk denotes hub. (F) Nep5 mRNA expression projected on the UMAP. (G) FISH of Nep5 mRNA (green) and DNA (magenta) showing the SV. (H) Nep4 (blue) and Nep5 (red) mRNA expression projected on the UMAP with corresponding heatmap. Arrows and arrowheads point to corresponding cell types in UMAPs and stained tissues. Bars: 20μm. (see also Figure 8—figure supplement 1).


