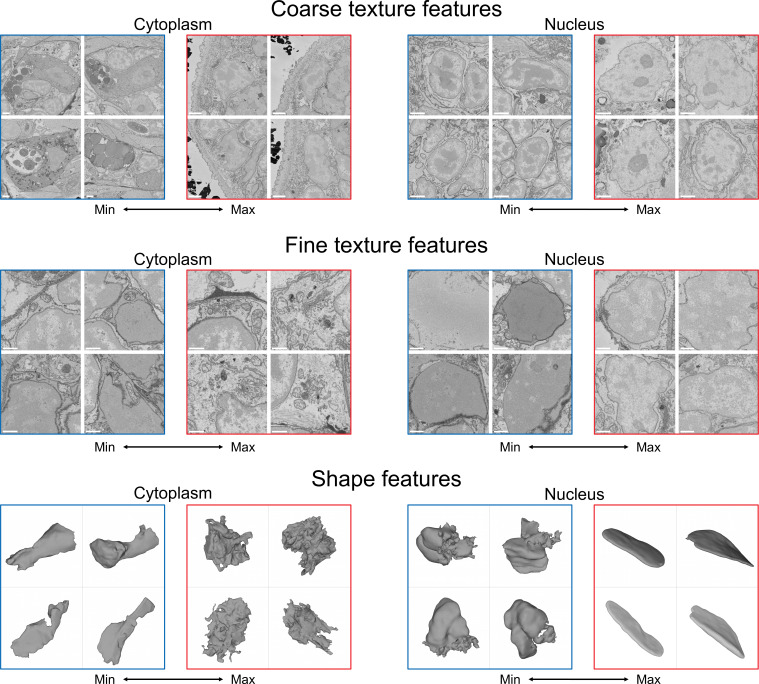
Figure 6. Visualisation of the learned features.
For each feature, four cells with a minimal (blue) and four cells with a maximal (red) value of the feature are shown, see text for detailed analysis. Shown are cytoplasm coarse texture feature 21, nuclear coarse texture feature 4, cytoplasm fine texture feature 50, nuclear fine texture feature 7, cytoplasm shape feature 14, and nuclear shape feature 66. Scale bars: coarse texture - 2μm, fine texture - 1μm.


