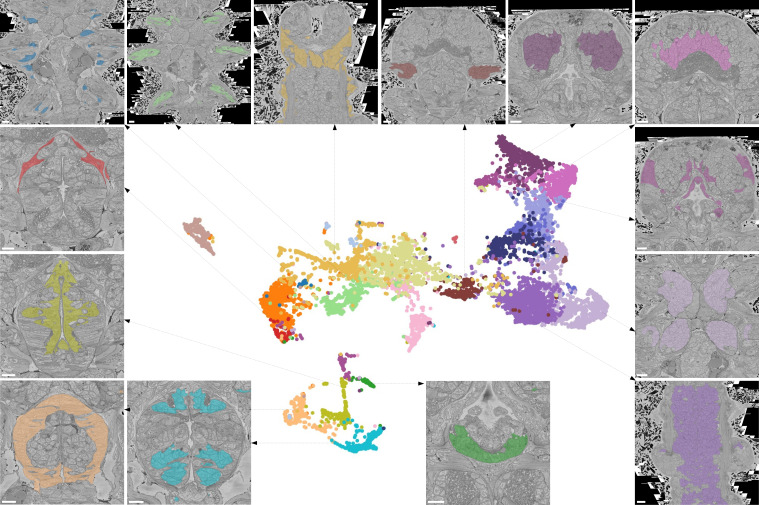
Figure 7. Characterising neighbourhoods with MorphoContextFeatures.
Clustering results are visualised on the MorphoContextFeatures UMAP representation. For some clusters, the cells comprising the cluster are shown in the animal volume to visualise the cell type. Upper panels (from left to right): secretory (blue) and epithelial (green) cells of parapodia, epithelial, and secretory cells of the head, cirral, palpal, and dorsal ganglia. Lower panels (from left to right): foregut muscles, foregut neurons, infracerebral gland, and ventral nerve cord. Left panels (from top to bottom): muscles surrounding the foregut and foregut epithelium. Right panels (from top to bottom): epithelial-sensory circumpalpal cells and peripheral ganglia. Scale bars: 10μm.

