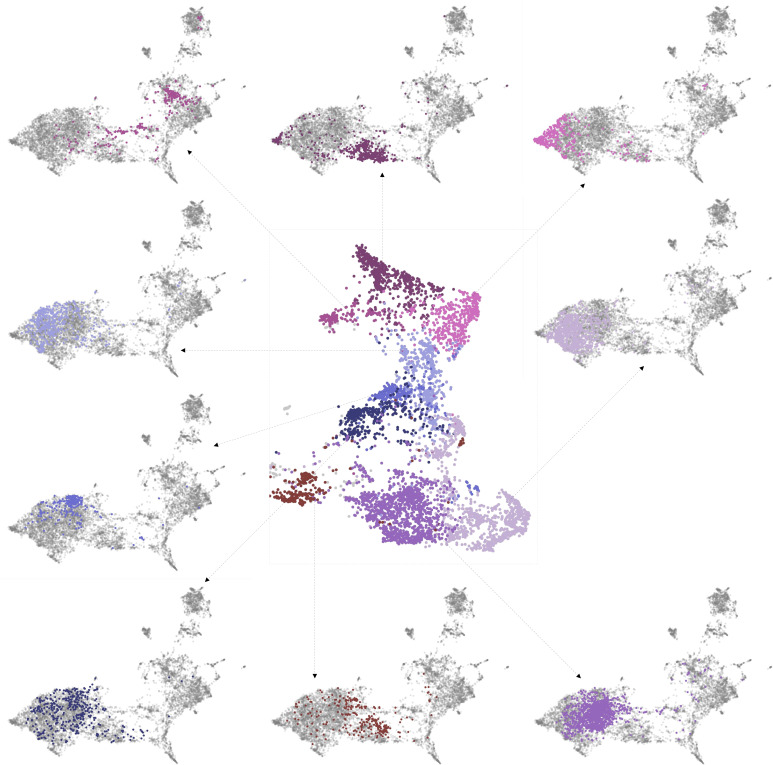
Figure 8. MorphoContextFeatures define ganglionic nuclei.
(A and B) The animal ganglia as defined by manual segmentation (Vergara et al., 2021), our MorphoContextFeature clustering and gene expression clustering displayed on (A) the UMAP representation and (B) in the animal volume. PG, palpal ganglia; CpG, circumpalpal ganglia; AG, antennal ganglia; MB, mushroom bodies; DG, dorsal ganglion; CG, cirral ganglia; VNC, ventral nerve cord. Scale bars: 10μm. (C) Gene expression dot plot of the ganglia defined by MorphoContextFeature clustering. The size of the dots shows how much of a cluster expresses a gene; the colour shows how much of the expression of a gene is confined to a cluster (see Materials and methods). (D) Some of the genes shown to be differentially expressed in the ganglia defined by MorphoContextFeature clustering, plotted on the UMAP representation.


