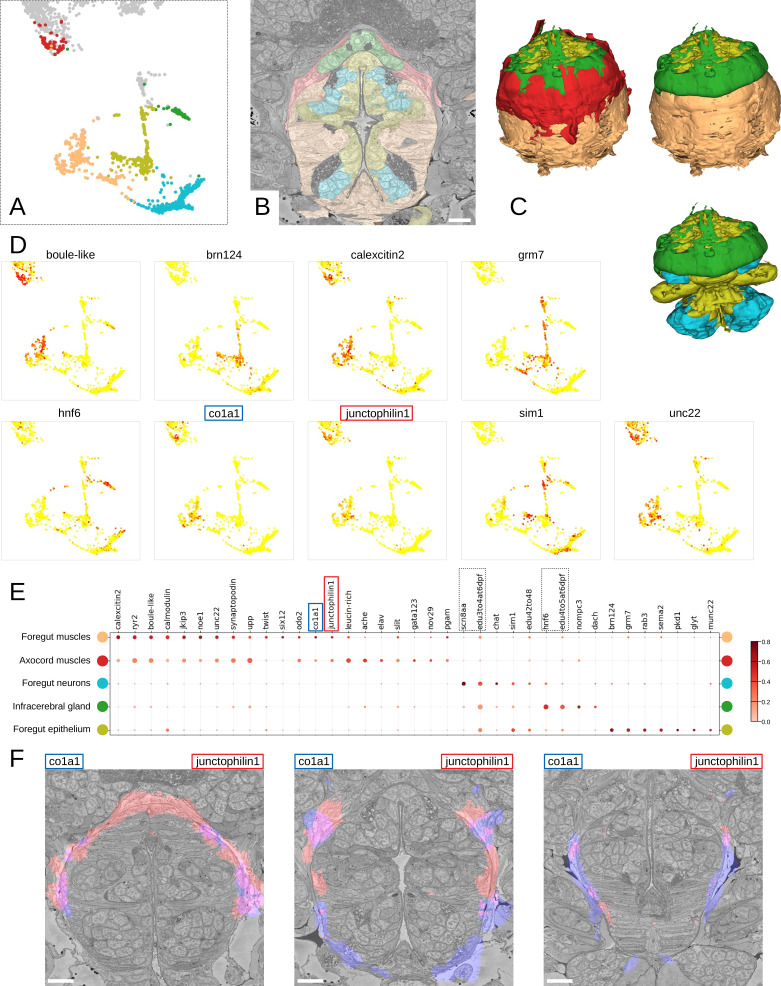
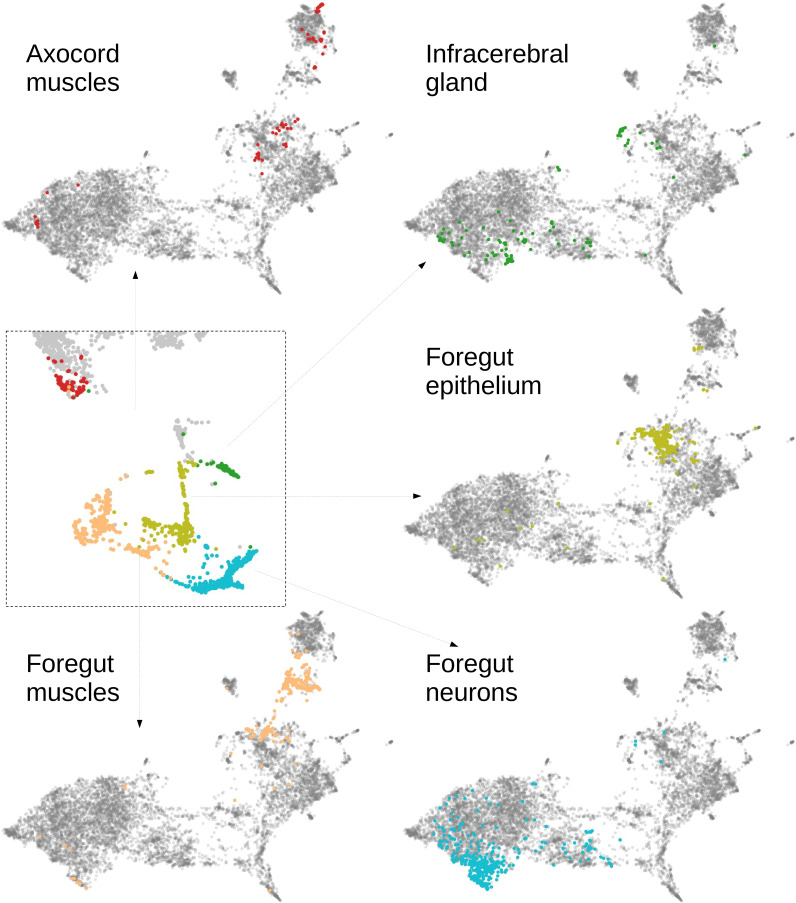
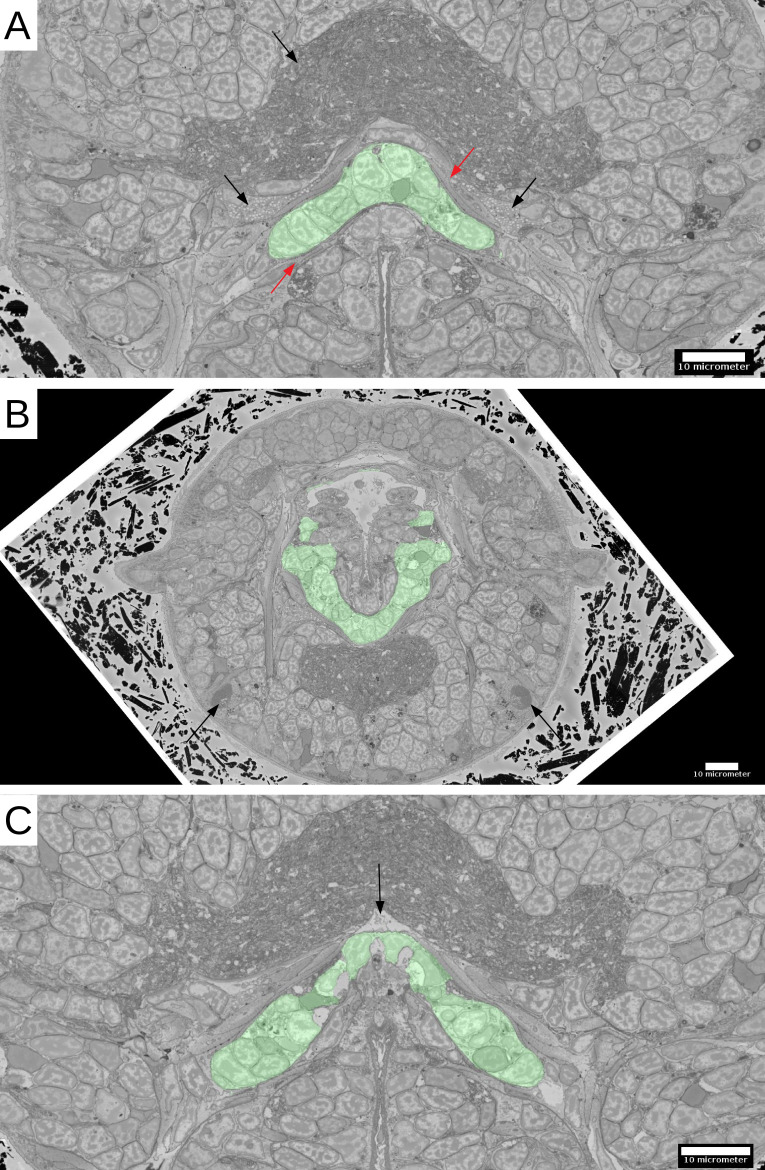
Figure 9. Detailed characterisation of the foregut.
(A) Foregut region clusters plotted on the UMAP representation. (B) The foregut tissues, as defined by the MorphoContextFeatures clustering, shown in the animal volume. Scale bar: 10μm. (C) A 3D visualisation of the foregut tissues, as defined by the MorphoContextFeatures clustering: all tissues (upper left panel), surrounding muscles removed (upper right panel), both muscle groups removed (lower panel). (D) Some of the genes shown to be differentially expressed in the foregut region clusters, plotted on the UMAP representation. (E) Gene expression dot plot of the foregut region clustering. The size of the dots shows how much of a cluster expresses a gene; the colour shows how much of the expression of a gene is confined to a cluster (see Materials and methods). The genes mentioned in the text are enboxed. (F) The genes specific to the axocord muscles, visualised on the animal volume. Scale bars: 10μm.


