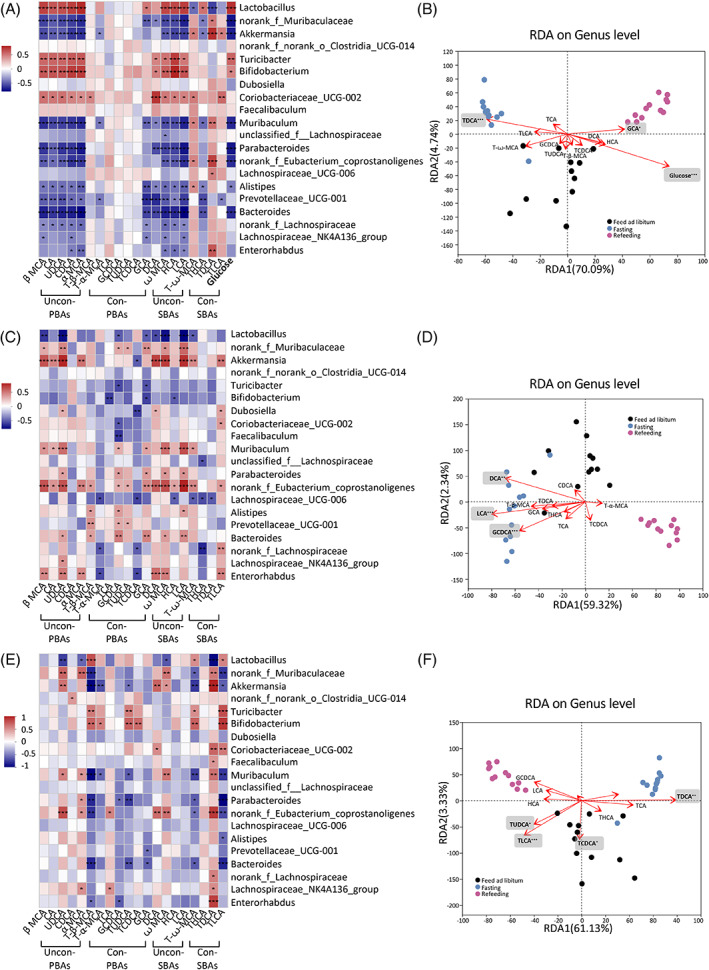
FIGURE 4.

Associations of bile acid and glucose with gut microbiota. Spearman's correlations of the bile acids concentration in plasma (A), feces (C), and liver tissue (E) with the relative abundance of top 20 microbial genera. The gradient colors represent the correlation coefficients, with red color being positive and blue color indicating negative. *p < .05, **p < .01, ***p < .001 (Spearman's correlation after the post hoc correction using the false discovery rate method). Redundancy analysis/canonical correlation (RDA/CCA) analysis of 16S rRNA gene sequencing data (symbols), bile acids (arrows) and glucose (arrow) in plasma (B), feces (D), and liver tissues (F). The values of axes 1 and 2 are the percentages explained by the corresponding axis. *p < .05, **p < .01, ***p < .001. PBA, primary bile acid; SBA, secondary bile acid; Con‐, conjugated; Uncon‐, unconjugated.
