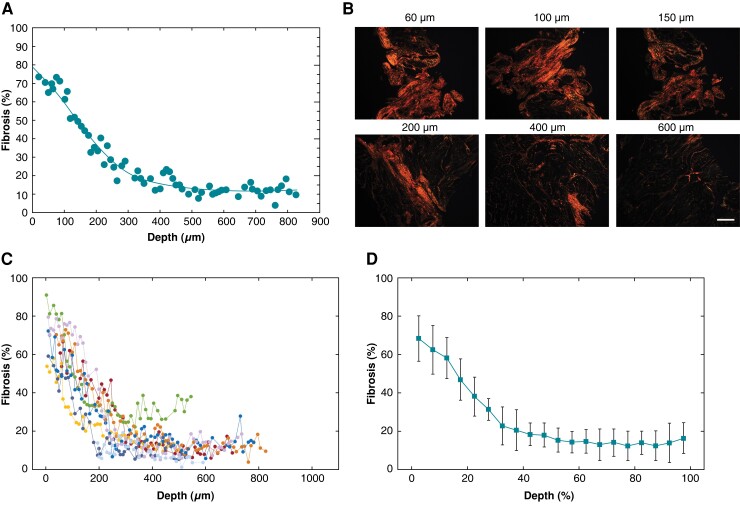
Figure 4.
Transmural fibrosis profile in atrial fibrillation (AF) patients. (A) Fibrosis fraction as a function of the distance from the epicardium in a representative AF patient. (B) Polarized light images of tissue slices at increasing distance from the epicardium. Scale bar: 500 µm. (C) Transmural fibrosis profile in the AF patient group (n = 8). Different colours and symbols indicate distinct patients. (D) Average transmural fibrosis profile in the AF group. To align patients’ profiles, distance was expressed in relative units (ratio, %).

